IMAGE

Figure 4

ID
ZDB-IMAGE-230707-102
Genes
Source
Figures for Hu et al., 2023
Image
Figure Caption

Figure 4

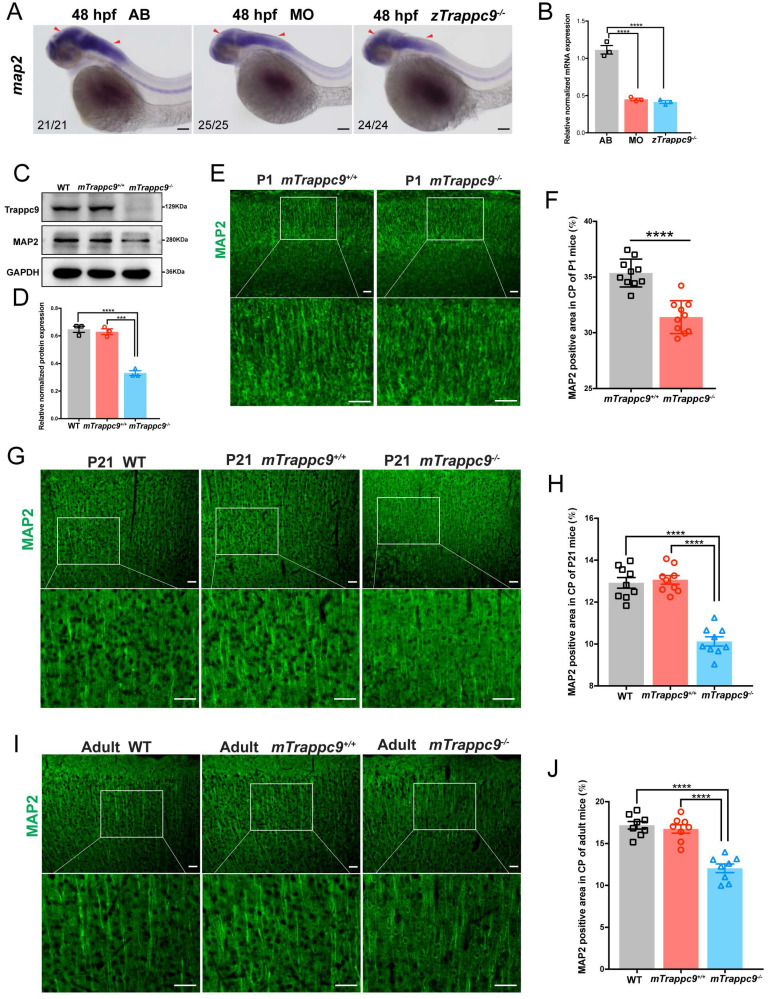
Dendrites of neurons are reduced after Trappc9 loss-of-function. (A-B), RNA in situ hybridization and RT-qPCR analysis of map2 mRNA expression in 48 hpf zebrafish embryos. The expression of map2 was reduced in mutant (zTrappc9m/m) and morphant (MO) zebrafish embryos. Representative images from n=20-25 embryos/group in 5 experiments (A); n=3 experiments (B). (C-D), Western blot analysis of MAP2 in adult mouse cerebral cortex showing significant reduction in the integrated density of MAP2 protein bands normalized with GAPDH. n=3 mice/group. (E-F), MAP2 immunostaining of neonatal (P1) mouse cerebral cortex showing a significant decrease in the area ratio of MAP2 fluorescence. Representative images from n=3 mice/group (E); n=10 sections (F). (G-H), MAP2 immunostaining of P21 mouse cerebral cortex showing a significant decrease in the area ratio of MAP2 fluorescence. Representative images from n=3 mice/group (G); n=9 sections (H). (I-J), MAP2 immunostaining of adult mouse cerebral cortex showing a significant decrease in the area ratio of MAP2 fluorescence. Representative images from n=3 mice/group (I); n=8 sections (J). Data are means ± SEM; t-tests (F); One-way ANOVA (B, D, H, J); ****P≤0.0001; ***P≤0.001; Scale bars: 50 μm (A, E, G, I).

Figure Data
Acknowledgments
This image is the copyrighted work of the attributed author or publisher, and ZFIN has permission only to display this image to its users. Additional permissions should be obtained from the applicable author or publisher of the image. Full text @ Int. J. Biol. Sci.