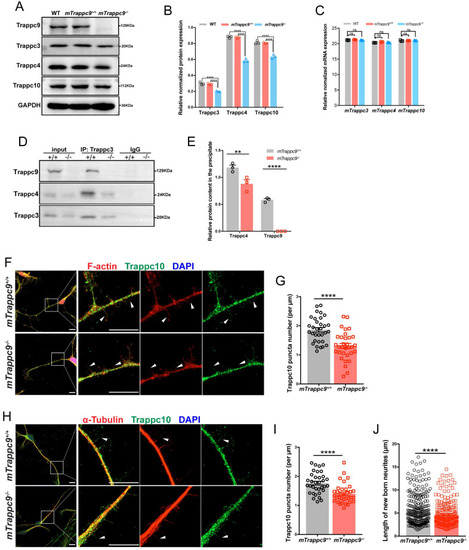
The distribution of Trappc10 along microfilaments and microtubules is reduced after mTrappc9 deficiency. (A, B), Western blot analysis of mTrappc3/4/9/10 in adult mouse cerebral cortex showing a significant decrease in the integrated density of protein bands normalized with GAPDH. n=3 mice/group. (C), RT-qPCR analysis of Trappc3, Trappc4, Trappc10 showing no significant differences. n=3 mice/group. (D, E), Co-immunoprecipitation with Trappc3 antibody. Trappc3 can pull down full-length mTrappc9 in the brain tissue lysate from mTrappc9+/+ mice, but not mTrappc9 m/m mice. Trappc4 can be co-immunoprecipitated by Trappc3 in mTrappc9+/+ mice but was significantly reduced in the co-precipitate of mTrappc9 m/m mice. n=3 mice/group. Quantitative data represent the ratio of precipitated protein over corresponding input for normalization. (F-I), Trappc10 and F-actin/α-tubulin immunostaining of mouse NSC-differentiated neurons cultured for 6 days showing significant decrease in the Trappc10 puncta number per micron of nascent neurites. Arrowheads indicated several nascent neurites, which showed the distribution of Trappc10 reduced in mTrappc9m/m neurons compared to mTrappc9+/+. Representative images from n=8 coverslips/group (F, H); n=32 nascent neurites (G, I). (J), Statistics of the length of nascent neurites in mTrappc9+/+ and mTrappc9m/m neurons. The nascent neurites of mTrappc9m/m are shorter than mTrappc9+/+. n=231 nascent neurites. Data are means ± SEM; t-tests (G, I, J); Two-way ANOVA (B, C, E); ****P≤0.0001; **P≤0.01; ns, not significant (P>0.05). Scale bars: 10 μm (F, H).
|
