IMAGE

Figure 5

ID
ZDB-IMAGE-230707-103
Source
Figures for Hu et al., 2023
Image
Figure Caption

Figure 5

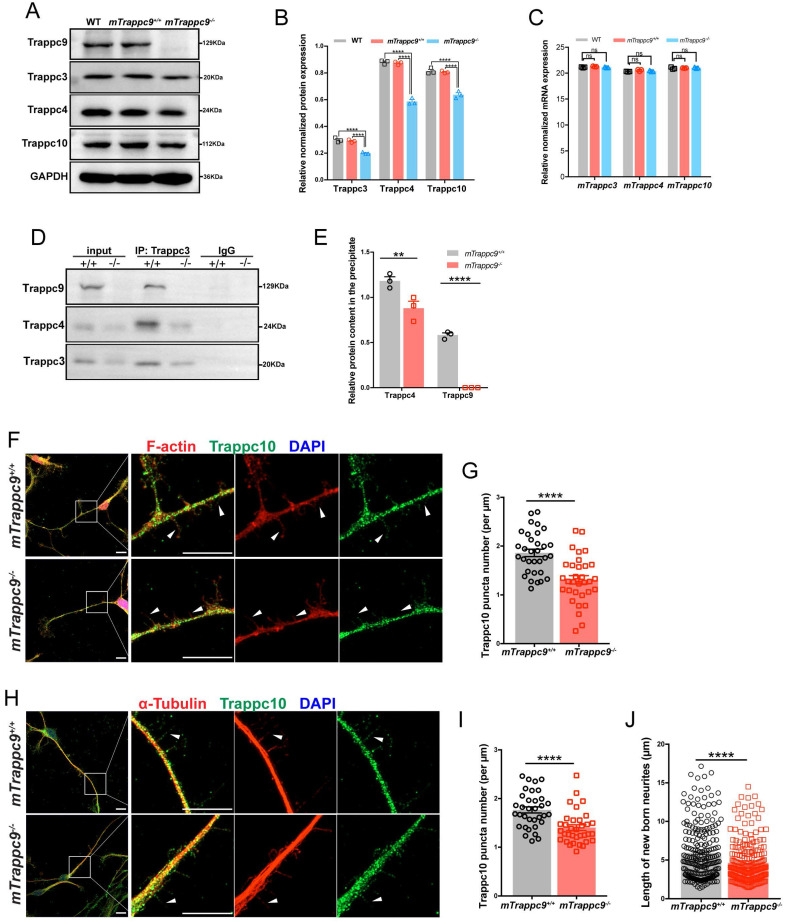
The distribution of Trappc10 along microfilaments and microtubules is reduced after mTrappc9 deficiency. (A, B), Western blot analysis of mTrappc3/4/9/10 in adult mouse cerebral cortex showing a significant decrease in the integrated density of protein bands normalized with GAPDH. n=3 mice/group. (C), RT-qPCR analysis of Trappc3, Trappc4, Trappc10 showing no significant differences. n=3 mice/group. (D, E), Co-immunoprecipitation with Trappc3 antibody. Trappc3 can pull down full-length mTrappc9 in the brain tissue lysate from mTrappc9+/+ mice, but not mTrappc9 m/m mice. Trappc4 can be co-immunoprecipitated by Trappc3 in mTrappc9+/+ mice but was significantly reduced in the co-precipitate of mTrappc9 m/m mice. n=3 mice/group. Quantitative data represent the ratio of precipitated protein over corresponding input for normalization. (F-I), Trappc10 and F-actin/α-tubulin immunostaining of mouse NSC-differentiated neurons cultured for 6 days showing significant decrease in the Trappc10 puncta number per micron of nascent neurites. Arrowheads indicated several nascent neurites, which showed the distribution of Trappc10 reduced in mTrappc9m/m neurons compared to mTrappc9+/+. Representative images from n=8 coverslips/group (F, H); n=32 nascent neurites (G, I). (J), Statistics of the length of nascent neurites in mTrappc9+/+ and mTrappc9m/m neurons. The nascent neurites of mTrappc9m/m are shorter than mTrappc9+/+. n=231 nascent neurites. Data are means ± SEM; t-tests (G, I, J); Two-way ANOVA (B, C, E); ****P≤0.0001; **P≤0.01; ns, not significant (P>0.05). Scale bars: 10 μm (F, H).

Acknowledgments
This image is the copyrighted work of the attributed author or publisher, and ZFIN has permission only to display this image to its users. Additional permissions should be obtained from the applicable author or publisher of the image. Full text @ Int. J. Biol. Sci.