FIGURE SUMMARY
Title

Association analysis and functional follow-up identified common variants of JAG1 accounting for risk to biliary atresia

Authors
Bai, M.R., Pei, H.Y., Zhou, Y., Song, H.L., Pan, W.H., Gong, Y.M., Wu, W.J., Yu, W.W., Cui, M.M., Gu, B.L., Chu, X., Cai, W.
Source
Full text @ Front Genet

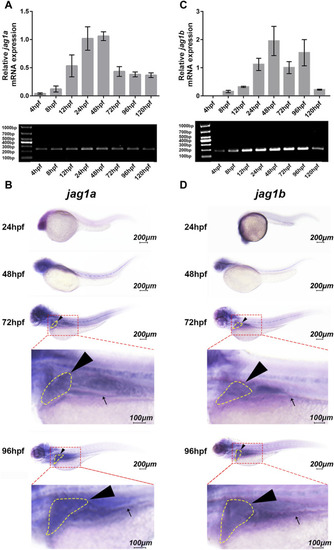
Spatiotemporal expression patterns of jag1a and jag1b in zebrafish larvae. (A, C) The relative transcript levels of jag1a and jag1b were analyzed by q-PCR during embryogenesis from 4hpf to 120hpf. (B, D) The spatial expression patterns of jag1a and jag1b were detected by WISH in 24hpf, 48hpf, 72hpf, and 96hpf zebrafish embryos. Black arrowheads and arrows mark liver and intestine respectively. Scale bar = 200 μm and 100 μm. All the data are shown as the mean ± SEM. q-PCR, quantitative polymerase chain reaction; hpf, hour postfertilization; WISH, whole-mount in situ hybridization; SEM, standard error of the mean.

EXPRESSION / LABELING:
Genes:
Fish:
Anatomical Terms:
Stage Range: Sphere to Day 5

The expression of jag1a or jag1b was effectively knocked down with MO. (A) The target sites of jag1a-SBMO and jag1b-SBMO are at I5E6 and I2E3, respectively. The target sites of jag1a-TBMO and jag1b-TBMO are both located in E1. (B, C) RT-PCR confirmed the effectiveness of jag1a-SBMO and jag1b-SBMO, which demonstrated by the appearance of abnormally spliced fragments marked by red arrows. Abbreviations: SBMO, splice-blocking morpholino; TBMO, translation-blocking morpholino; E, exon; I, intron; RT-PCR, reverse transcription-polymerase chain reaction.

Morphological abnormality of 5dpf zebrafish injected with jag1a and jag1b MOs. (A) Presentative morphology of zebrafish injected with control MO; (B) The typical deformed zebrafish injected with jag1a MOs; (C) The typical deformed zebrafish injected with jag1b MOs; (D) The statistics of malformation rate of jag1a and jag1b morphants were higher than that of control MO group. Except for jag1a-TBMO group, there was significant difference between them and control MO group. Scale bar = 500 μm. All the data are shown as the mean ± SEM. *p < 0.05; **p < 0.01; ***p < 0.001; ****p < 0.0001. dpf, day postfertilization; MO, morpholino; SEM, standard error of the mean.

Knockdown of jag1a or jag1b led to biliary dysfunction in zebrafish. (A) The right lying view of 5dpf zebrafish larvae after swallowing PED-6 showed that the gallbladders of jag1a or jag1b morphants were weaker and smaller than those of embryos injected with control MO. (B) Quantitative analysis showed that the accumulation of PED-6 in the gallbladders of jag1a or jag1b morphants were significantly reduced (p < 0.0001, χ2 test). Scale bar = 100 μm *p < 0.05; **p < 0.01; ***p < 0.001; ****p < 0.0001. Abbreviations: dpf, day post fertilization; PED-6, N-((6-(2,4-dinitrophenyl) amino) hexanoyl)-1-palmitoyl-2-BODIPY-FL-pentanoyl-sn-glycero-3-phosphoethanolamine.

Knockdown of jag1a or jag1b led to biliary defects in zebrafish. (A) Confocal projection on 5dpf control larvae and jag1 morphants stained with cytokeratin 18 showed that the intrahepatic bile ducts of jag1a or jag1b morphants were sparse compared to controls. (B) Confocal projection on 5dpf control larvae and jag1 morphants stained with cytokeratin 18 showed that gallbladders of jag1a or jag1b morphants were smaller or even no compared to those of embryos injected with control MO. Gallbladder cells were noted by white dots. (C) Quantitative analysis of the numbers of total ducts, interconnecting ducts and terminal ductules showed that intrahepatic bile ducts were significantly reduced in both jag1a and jag1b morphants compared with the embryos injected with control MO. (D) Quantitative analysis of the number of gallbladder cells, the measured area of gallbladders and the mean area of individual gallbladder cell showed that both jag1a and jag1b morphants had smaller gallbladders and individual gallbladder cells compared to the embryos injected with control MO. Scale bar = 100 μm. All the data are shown as the mean ± SEM. *p < 0.05; **p < 0.01; ***p < 0.001; ****p < 0.0001. dpf, day post fertilization; SEM, standard error of the mean.

Acknowledgments
This image is the copyrighted work of the attributed author or publisher, and ZFIN has permission only to display this image to its users. Additional permissions should be obtained from the applicable author or publisher of the image. Full text @ Front Genet