
- Title
-
Zebrafish cutaneous injury models reveal Langerhans cells engulf axonal debris in adult epidermis
- Authors
- Peterman, E., Quitevis, E.J.A., Black, E.C., Horton, E.C., Aelmore, R.L., White, E., Sagasti, A., Rasmussen, J.P.
- Source
- Full text @ Dis. Model. Mech.

Ex vivo scale explants as a model for Wallerian degeneration. (A) Schematic depicting the anatomy of the adult zebrafish scale epidermis and scale removal. The stratified epidermis (above the bony scale) is innervated by the peripheral axons of dorsal root ganglion somatosensory neurons. Confocal image shows an example of an entire scale explant expressing a somatosensory axon reporter [magenta; Tg(p2rx3a:mCherry)]. (B-D) Confocal images of time-lapses of explanted scales from adults expressing a somatosensory axon reporter [Tg(p2rx3a:mCherry)]. Scales were treated with DMSO as a vehicle control (B), FK866 (C) or DSRM-3716 (D). Dotted line boxes denote the regions magnified in insets. Note the lack of axon degeneration in the FK866- and DSRM-3716-treated scales. See Movie 1. (E,F) Percentage of axons undergoing degeneration (E) and the axon degeneration index (F) in control, FK866-treated and DSRM-3716-treated scales. n=8 for control, n=12 for FK866, n=8 for DSRM-3716 [regions of interest (ROIs)]. Two-way ANOVA followed by Bonferroni tests determined significance of differences between control, FK866 and DSRM-3716. *P<0.05, **P<0.01, ***P<0.001, ****P<0.0001. Scale bars: 1 mm (A), 20 μm (B-D), 5 μm (B-D, insets). Error bars in E and F represent s.d. |
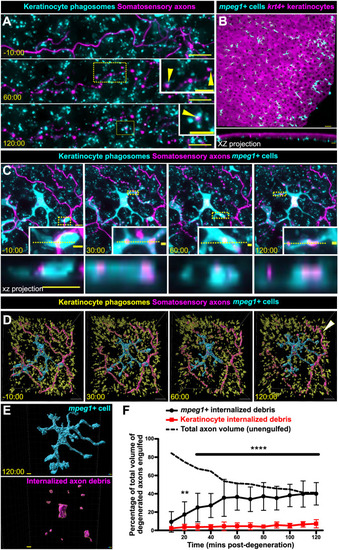
mpeg1+ cells, not keratinocytes, engulf the majority of axon debris following axon degeneration. (A) Confocal images from a time-lapse of scale pluck-induced axon degeneration from an adult expressing reporters for keratinocyte phagosomes [Tg(krt4:EGFP-2xFYVE);TgBAC(ΔNp63:EGFP-2xFYVE)] and somatosensory axons [Tg(p2rx3a:mCherry)]. Arrowheads show examples of colocalization. Time denotes mm:ss relative to the onset of axon degeneration. See Movie 2. (B) Lateral confocal image (top) and reconstructed cross-section (bottom), showing that mpeg1+ cells (cyan) densely populate the scale epidermis and reside beneath the krt4+ layer (magenta). (C) Confocal images from a time-lapse of axon degeneration from an adult expressing reporters for keratinocyte phagosomes [Tg(krt4:EGFP-2xFYVE);TgBAC(ΔNp63:EGFP-2xFYVE)], somatosensory axons [Tg(p2rx3a:mCherry)] and mpeg1+ cells [Tg(mpeg1:NTR-EYFP)] before and during scale pluck-induced axon degeneration. Yellow dotted lines in insets denote the plane reconstructed in the xz projections. Time denotes mm:ss relative to the onset of axon degeneration. See Movies 3 and 4. (D) Surface views from Imaris of the panels in C showing keratinocyte phagosomes (yellow), mpeg1+ cell (cyan) and somatosensory axons (magenta). Arrowhead indicates intact axon. (E) Surface view used in Imaris from C (120:00) for volume-engulfed quantifications. (F) Quantification of total axon volume engulfed over time by keratinocytes and mpeg1+ cells. Two-way ANOVA followed by Bonferroni tests determined significance of differences between mpeg1+ cells and keratinocytes. **P<0.01, ****P<0.0001. n=10-16 cells/ROIs from n=12 scales from N=9 fish. Scale bars: 5 μm [A, insets, C, C (xz projection), E], 10 μm (A,D), 30 μm (B), 2 μm (C, insets). Error bars in F represent s.d. |

mpeg1+ cells engulf axonal debris after cutaneous injury in vivo. (A) Schematic for inducing scale injury via micro scissors in vivo. (B) Confocal images from a time-lapse of in vivo micro scissor scale injury from an adult expressing reporters for somatosensory axons [Tg(p2rx3a:mCherry)] and mpeg1+ cells [Tg(mpeg1:NTR-EYFP)]. Solid white lines outline scales from fish, yellow dashed line oval denotes site of micro scissor injury, yellow dotted line box denotes the region magnified in B′. Yellow dotted line boxes in B′ denote the regions magnified in insets. Time denotes mm:ss relative to the time of injury. See Movies 5 and 6. (C) Schematic for laser axotomy in vivo. Representative image of axons pre- (left) and post- (right) laser axotomy. Yellow asterisk denotes site of axotomy. (D) Confocal images from a time-lapse of axon degeneration from an adult expressing reporters for keratinocyte phagosomes [Tg(krt4:EGFP-2xFYVE);TgBAC(ΔNp63:EGFP-2xFYVE)], somatosensory axons [Tg(p2rx3a:mCherry)] and mpeg1+ cells [Tg(mpeg1:NTR-EYFP)] before and during laser axotomy-induced axon degeneration. Arrowhead denotes engulfed axonal debris. (E) Quantification of total axon volume engulfed over time by keratinocytes and mpeg1+ cells. Two-way ANOVA followed by Bonferroni tests determined significance of differences between mpeg1+ cells and keratinocytes. **P<0.01. n=8 ROIs from N=3 fish. Scale bars: 100 μm (B), 20 μm (B′), 10 μm (C,D). Error bars in E represent s.d. |

Langerhans cells represent the mpeg1+ cell type that engulfs cutaneous axon debris. (A) Schematic (left) and corresponding fluorescent image (right) comparing the morphology of a Langerhans cell (arrow) and a metaphocyte (arrowhead). (B) Quantification of axonal debris engulfed relative to number of protrusions in mpeg1+ cells 60 min post-scale pluck-induced axon degeneration, n=12 scales from N=9 fish. (C) Fluorescence in situ hybridization with HCR probes against cd4-1 following scale pluck-induced axon degeneration. Arrows indicate cd4-1 expression in mpeg1+ cell; arrowheads indicate engulfed axonal debris. (D) Fluorescence images of the scale epidermis in an adult expressing Tg(mpeg1:NTR-EYFP), Tg(mfap4:tdTom-CAAX) and a somatosensory axon reporter [Tg(p2rx3a:mCherry)]. Arrows indicate mpeg1+/mfap4+ cells (Langerhans cells); arrowheads indicate an mpeg1+ only cell (metaphocyte). (E,F) Still images of the scale epidermis in a Tg(mpeg1:NTR-EYFP);Tg(mfap4:tdTom-CAAX);Tg(p2rx3a:mCherry) adult before and during scale pluck-induced axon degeneration. Arrowheads indicate engulfed axonal debris. Time denotes mm:ss. Scale bars: 5 μm (A), 10 μm (C-F). Error bars in B denote s.d. |

Keratinocytes do not compensate for the absence of Langerhans cells. (A,B) Representative widefield images of the scale epidermis in Tg(mpeg1:NTR-EYFP) adults after 3 days of mock treatment (A) or 7 mM MTZ treatment to ablate mpeg1+ cells (B). mpeg1+ cells: 255.1±133.17 and 73.8±23.28 (mean±s.d.) after 3 days of mock or MTZ treatment, respectively. (C) Quantification of debris engulfed by keratinocytes after 3 days of exposure to MTZ in animals with or without Tg(mpeg1:NTR-EYFP) (denoted as +MTZ mpeg1 ablation or +MTZ control, respectively). Two-way ANOVA followed by Bonferroni tests determined significance of differences between (+MTZ−NTR) and (+MTZ+NTR) conditions. *P<0.05. n=4-10 ROIs for +MTZ−NTR (from three fish, six scales) and n=15-16 ROIs for +MTZ+NTR (from seven fish, 13 scales). (D,E) Representative confocal images of mpeg1+ cells in the scale epidermis from adults of the indicated genotypes. Note the lack of mpeg1+ cells with the dendritic morphology of Langerhans cells in the csf1ramh5/mh5; csf1rbmh108/mh108 mutant epidermis. Yellow dotted line boxes denote the regions magnified in insets. (F) Quantification of debris engulfed by keratinocytes in adults of the indicated genotypes. n=6-11 ROIs for csf1ramh5/+; csf1rbmh108/+ (from three fish, four scales) and n=10 ROIs for csf1ramh5/mh5; csf1rbmh108/mh108 (from three fish, five scales). Scale bars: 20 μm (A,B,D,E), 10 μm (D,E, insets). Error bars in C and F represent s.d. |