
- Title
-
Metabolic regulation of cholestatic liver injury by D-2-hydroxyglutarate with the modulation of hepatic microenvironment and the mammalian target of rapamycin signaling
- Authors
- Tian, X., Wang, Y., Lu, Y., Wu, B., Chen, S., Du, J., Cai, W., Xiao, Y.
- Source
- Full text @ Cell Death Dis.
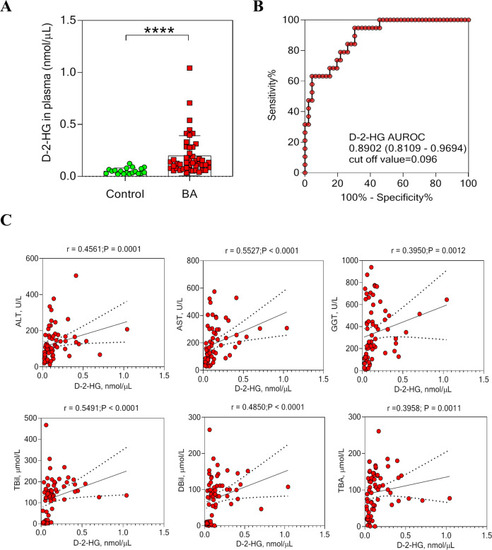
D-2-HG contents were increased in BA patients and correlated with liver injury.
A The D-2-HG expression was detected in the plasma of BA patients (n = 46) and controls (n = 19). B The receiver operating characteristic (ROC) was constructed by plasma D-2-HG. C Correlation analysis of plasma D-2-HG levels with alanine aminotransferase (ALT), aspartate aminotransferase (AST), γ-glutamyltransferase (GGT), total bilirubin (TBil), direct bilirubin (DBil), and total bile acid (TBA) levels. Statistical significance: ****p < 0.0001. |

Accumulation of D-2-HG was correlated with TET activity in BA patients.
A The D-2-HG expression was detected in the livers of BA (n = 13) and controls (n = 8). B The relative expression of D2HGDH mRNA in the livers of BA (n = 45) and controls (n = 17). C Representative images of western blotting (WB) for D2HGDH. Quantification of D2HGDH against β-actin. D 5mC-Hydroxylase TET activity was determined in the livers of BA patients (n = 19) and controls (n = 8). E Correlation analysis of plasma D-2-HG levels with 5mC-Hydroxylase TET activity in liver tissues. F Representative Immunohistochemistry (IHC) images of TET1 in livers of BA patients (n = 6) and controls (n = 6). The quantification of TET1 positive cells. Statistical significance: *p < 0.05. |

Mitochondrial respiration and ATP synthase decreased in BA patients.
A Representative immunohistochemistry (IHC) images of HNF-4α in livers of BA patients (n = 6) and controls (n = 6). The quantification of HNF-4α+ cells. B The relative expression of HNF4A, CAPN1, and OPA1 mRNAs in the liver of BA and controls. C Representative images of western blotting (WB) for P-AMPK, AMPK, ATPB, P-4EBP1, and 4EBP1 and quantification of WB. Statistical significance: *p < 0.05. |
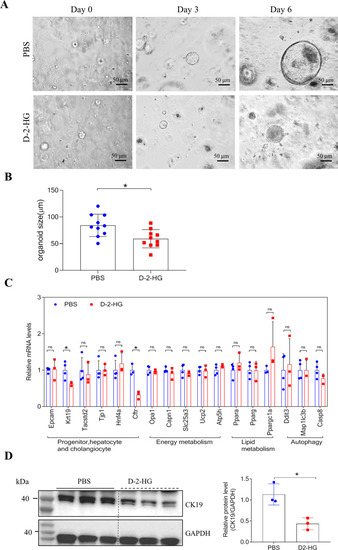
D-2-HG restrained the growth of liver organoids.
A Representative size and morphology of culture organoids treated with PBS, or 5 mM D-2-HG at the indicated time. B Quantification for the size of organoids in panel (A). C The relative expression of involved genes mRNA in the liver organoids with or without 5 mM D-2-HG exposure. D At 4 h after PBS or 5 mM D-2-HG exposure, the proteins of the EpCAM+ cells were extracted for western blotting (WB). Representative images of WB for CK19. Quantification of CK19 against GAPDH. ns, not significant, *P < 0.05. |
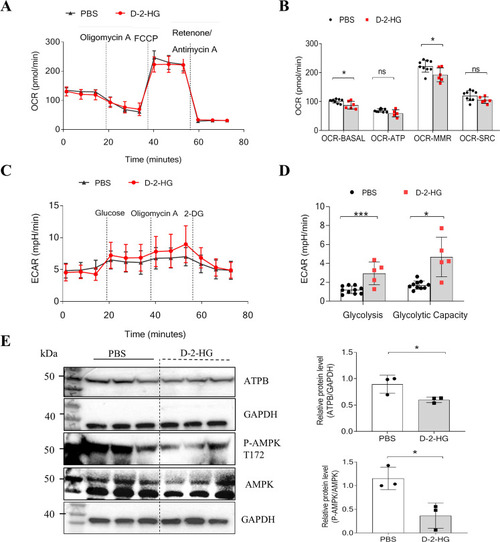
D-2-HG inhibited mitochondrial respiration in liver organoids.
A Representative OCR experiments were analyzed in liver organoids treated with PBS, or 5 mM D-2-HG, using the Seahorse XF96 extracellular flux analyzer. Each group, n = 6–10. B Levels of mitochondrial respiratory function: basal respiration (OCR-BASAL), ATP production (OCR-ATP), maximal respiration (OCR-MMR), and spare respiratory capacity (OCR-SRC) in liver organoids. C Representative ECAR experiments performed on liver organoids treated with PBS or 5 mM D-2-HG. D Levels of glycolysis and maximal glycolytic capacity in liver organoids. E At 4 h after PBS or 5 mM D-2-HG exposure, the proteins of the EpCAM+ cells were extracted for western blotting (WB). The WB was used to determine the amounts of P-AMPK, AMPK, and ATPB (n = 3). ns, not significant, *P < 0.05, ***P < 0.001. |
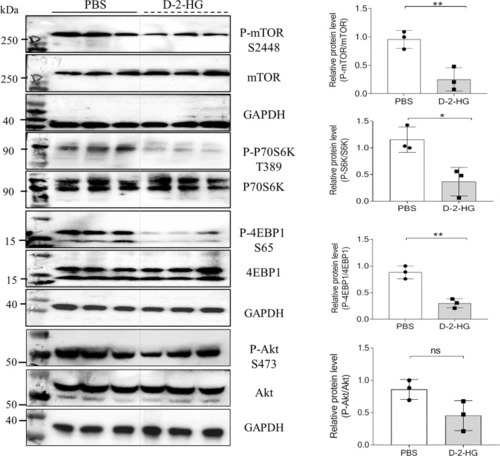
D-2-HG suppressed the mTOR signaling.
At 4 h after PBS or 5 mM D-2-HG exposure, the proteins of the EpCAM+ cells were extracted for western blotting (WB). Representative WB analysis for the key proteins in the mTOR signaling, including mTOR, p70 S6K, 4EBP1, and AKT. Quantification for the expression of key proteins in the mTOR signaling. ns, not significant, *P < 0.05, **P < 0.01. |
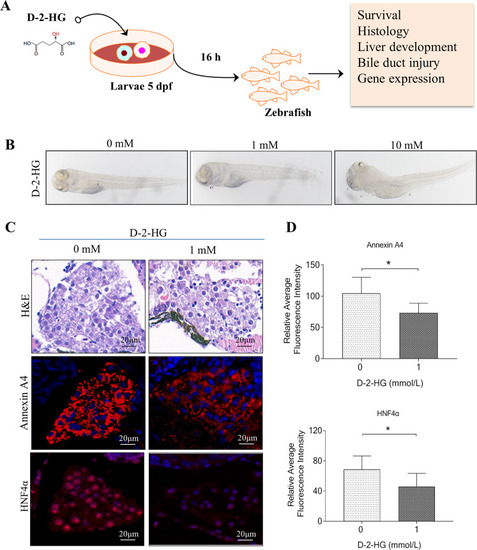
D-2-HG exposure caused liver degeneration in zebrafish.
A Experimental scheme depicting the treatment of 5 dpf larvae with different concentrations of D-2-HG (0, 0.5, 1, 5, 10, and 20 mM) for 16 h before analysis. B The whole morphology of larvae. C Livers of 5-dpf larvae were performed with hematoxylin-eosin (H&E) staining and immunostained with anti-Annexin A4 and HNF-4α fluorescence intensity. D Quantification of Annexin A4 and HNF-4α in the panel (C). *P < 0.05, **P < 0.01. |
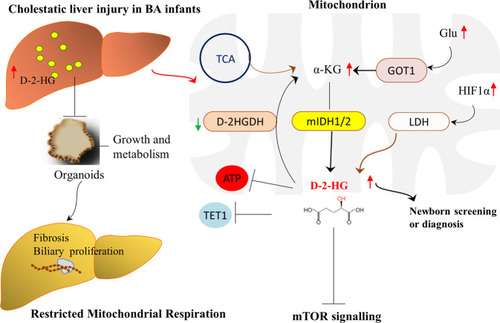
Schematic diagram of potential mechanisms that D-2-HG involved in liver regeneration in BA patients.
Biliary atresia is incurable and needs liver transplantation. Using targeted metabolomics, we unexpectedly identified a metabolite 2-hydroxyglutarate (2-HG) that has great potential in diagnosis or newborn screening. By using ‘mini organs of liver’ in vitro and a zebrafish model in vivo, we demonstrate D-2-HG accumulates in the liver and alters the hepatic microenvironment, and subsequently impairs liver regeneration via reducing the mitochondrial respiration and ATP synthase. Our findings reveal D-2-HG has a novel pathogenic mechanism that could have important diagnostic and therapeutic implications. |