
Image
|
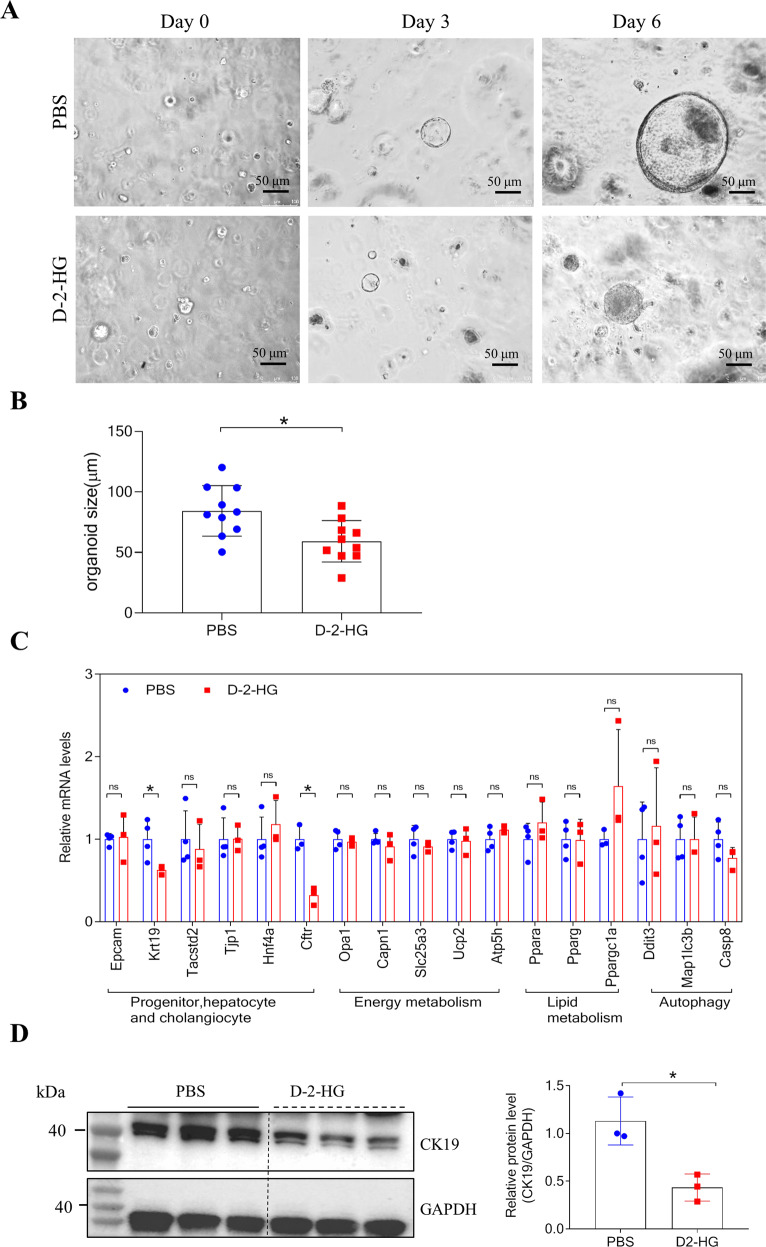
Figure Caption
Fig. 4
D-2-HG restrained the growth of liver organoids.
A Representative size and morphology of culture organoids treated with PBS, or 5 mM D-2-HG at the indicated time. B Quantification for the size of organoids in panel (A). C The relative expression of involved genes mRNA in the liver organoids with or without 5 mM D-2-HG exposure. D At 4 h after PBS or 5 mM D-2-HG exposure, the proteins of the EpCAM+ cells were extracted for western blotting (WB). Representative images of WB for CK19. Quantification of CK19 against GAPDH. ns, not significant, *P < 0.05.
Acknowledgments
This image is the copyrighted work of the attributed author or publisher, and
ZFIN has permission only to display this image to its users.
Additional permissions should be obtained from the applicable author or publisher of the image.
Full text @ Cell Death Dis.