
|
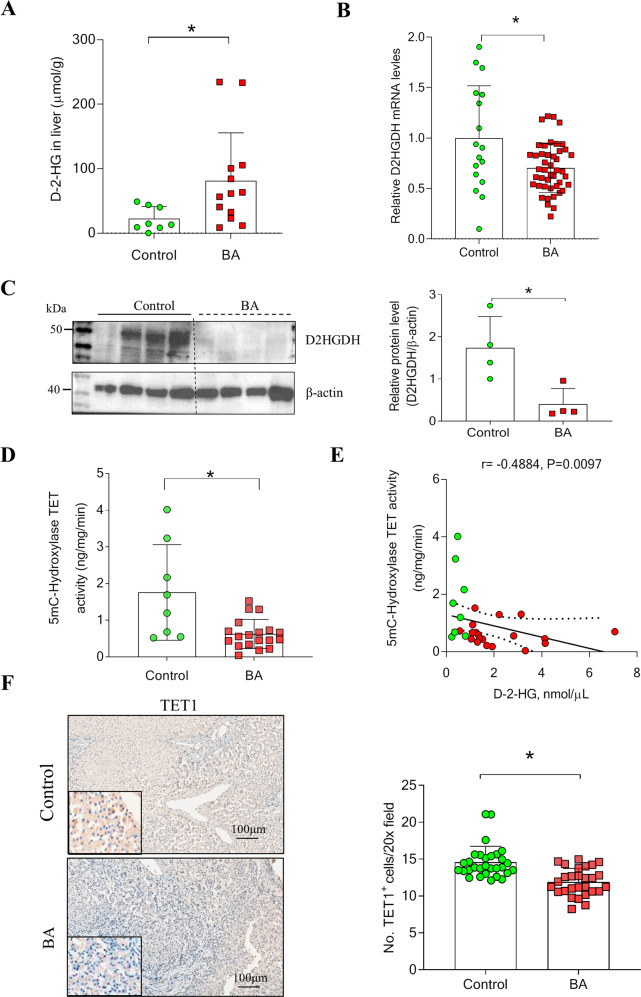
Fig. 2
A The D-2-HG expression was detected in the livers of BA (n = 13) and controls (n = 8). B The relative expression of D2HGDH mRNA in the livers of BA (n = 45) and controls (n = 17). C Representative images of western blotting (WB) for D2HGDH. Quantification of D2HGDH against β-actin. D 5mC-Hydroxylase TET activity was determined in the livers of BA patients (n = 19) and controls (n = 8). E Correlation analysis of plasma D-2-HG levels with 5mC-Hydroxylase TET activity in liver tissues. F Representative Immunohistochemistry (IHC) images of TET1 in livers of BA patients (n = 6) and controls (n = 6). The quantification of TET1 positive cells. Statistical significance: *p < 0.05.