FIGURE SUMMARY
Title

Presence of chondroitin sulphate and requirement for heparan sulphate biosynthesis in the developing zebrafish inner ear

Authors
Jones, A.A., Diamantopoulou, E., Baxendale, S., Whitfield, T.T.
Source
Full text @ Front Cell Dev Biol

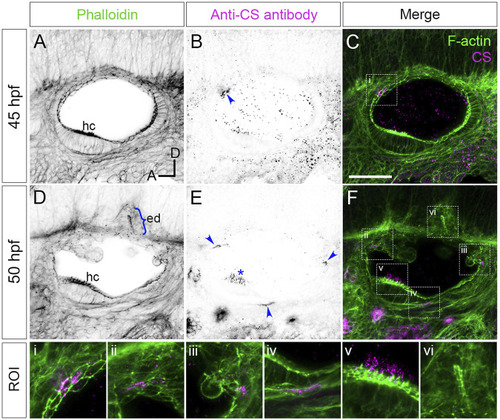
Staining for chondroitin sulphate in phenotypically wild-type zebrafish ears marks sites of epithelial projection outgrowth.

(A–F) Confocal images of Alexa-phalloidin (green) and anti-CS antibody (magenta) whole-mount stains of phenotypically wild-type ears (Section 2). Blue arrowheads mark foci of chondroitin sulphate (CS) staining associated with the emergence (evagination) of epithelial projections from the otic epithelium; blue bracket marks the invaginating endolymphatic duct (ed); blue asterisk marks staining in the otolithic membrane overlying hair cells of the anterior (utricular) macula. Boxed areas highlight regions of interest (ROI), enlarged in the bottom row of panels: (i), apical focus of CS staining at 45 hpf prefiguring site of emergence of the anterior projection; (ii,iii), foci of CS staining associated with the anterior and posterior projections, respectively, at 50 hpf; (iv), basal focus of CS staining prefiguring site of emergence of the ventral projection; (v), CS staining in the utricular otolithic membrane; (vi), absence of CS stain in the endolymphatic duct. All panels are lateral views with anterior to left, and dorsal to top (orientation shown in (A): A, anterior; D, dorsal). Scale bar in (C), 50 µm (applies to (A–F)). Abbreviations: CS, chondroitin sulphate; ed, endolymphatic duct; hc, stereociliary bundles on the apices of hair cells in the anterior (utricular) macula. Additional examples and developmental stages are shown in Figure 4; Supplementary Figure S1; Supplementary Movie S1.

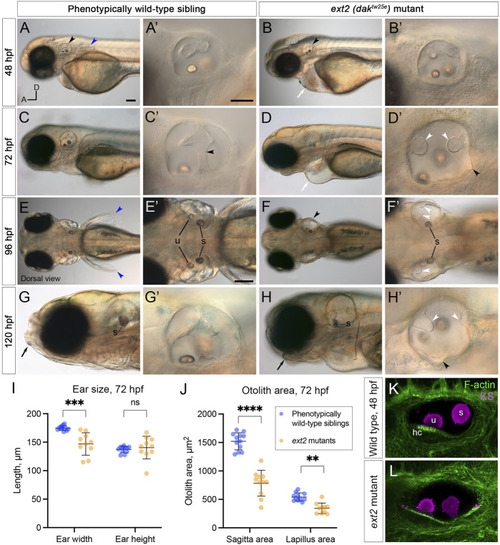
Morphological defects in the inner ear of ext2 mutant embryos. (A–H’) Live DIC images of phenotypically wild-type sibling and ext2 homozygous mutant embryos at 48–120 hpf. The otic vesicle (enlarged in the second and fourth columns) is marked with a black arrowhead in (A,B,F). Note the absence of the pectoral fin bud [(A,E), blue arrowheads in wild type], cardiac oedema [(B,D), white arrows], and abnormal jaw [(G,H), black arrows] in the mutant. At 72 hpf, epithelial projections have fused and formed pillars in the wild-type ear [black arrowhead in (C’) marks the fusion plate of the ventral pillar], whereas in the ext2 mutant ear, the projections stayed small and often did not fuse [white arrowheads, (D’,F’,H’)]. Black arrowheads in (D’) and (H’) mark abnormal out-pocketings of the epithelium. Scale bars: (A), 100 μm [also applies to (B,C,D,E,F,G,H)]; (A’), 50 μm [also applies to (B’,C’,D’,G’,H’)]; (E’), 100 μm [also applies to (F’)]. All panels are lateral views with anterior to the left (orientation shown in (A): A, anterior; D, dorsal), apart from (E–F’) (dorsal views, anterior to the left). (I,J) Morphometric measurements of ear width and height (I), and otolith area (J), traced from micrographs at 72 hpf [N = 6 embryos, n = 12 ears of each genotype (some data points missing)]. See Supplementary Figure S2 for details. Horizontal bars show mean +/− standard deviation. Two-way ANOVA (mixed-effects model) with Šídák’s correction for multiple comparisons: ns, not significant; **p = 0.0082; ***p = 0.0008; ****p < 0.0001. (K,L) Ears at 48 hpf, stained with Alexa phalloidin (green) and an antibody to keratan sulphate (magenta). Abbreviations: hc, hair cells in the utricular macula; s, saccular otolith (sagitta); u, utricular otolith (lapillus).

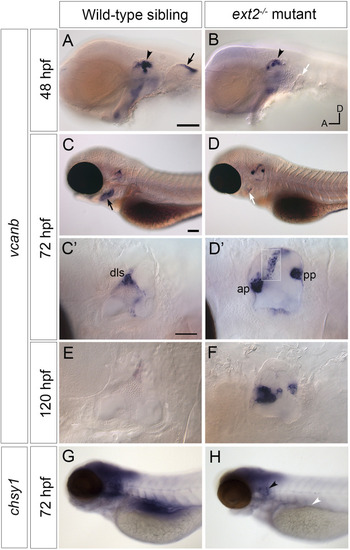
Expression of vcanb and chsy1 in the ext2 mutant ear. (A–H)In situ hybridisation to vcanb(A–F) and chsy1(G,H) mRNA in phenotypically wild-type sibling and ext2 mutant embryos. (A) Expression of vcanb is present in the ear (black arrowhead) and pectoral fin (black arrow) in sibling embryos. (B) Only a rudimentary pectoral fin bud is present in the ext2 mutant, and the associated vcanb staining is missing (white arrow). (C,D) At 72 hpf, vcanb expression is strongly reduced in the periderm of the second arch (future operculum) in ext2 mutants [black arrowhead in (C), white arrowhead in (D)]. (C’,D’) Enlargements of the ears shown in (C,D), respectively. Expression of vcanb is now down-regulated in the pillars of the wild-type ear, remaining only in the dorsolateral septum (dls). In the ext2 mutant, expression persists abnormally in the unfused anterior and posterior projections [ap, pp, (D’)] and in an abnormal pillar-like structure (boxed insert of same ear taken at a different focal plane). (E,F)vcanb expression persists abnormally in the unfused projections in mutant ears until at least 120 hpf. (G,H) Overall levels of chsy1 expression are slightly reduced in ext2 mutants (H); expression is missing in the viscera (white arrowhead), but persists in unfused epithelial projections in the ear (black arrowhead). All panels are lateral views with anterior to the left, dorsal to the top (orientation shown in (B): A, anterior; D, dorsal). Scale bars: in (A), 100 μm (also applies to (B)); in (C), 100 μm [also applies to (D,G,H)]; in (C), 50 μm [also applies to (D’)].

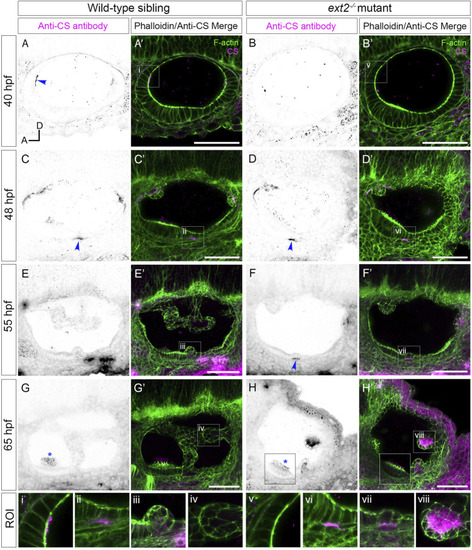
Staining for chondroitin sulphate in the ext2 mutant ear is delayed at early stages, but accumulates abnormally in unfused epithelial projections by 65 hpf. (A–H’) Confocal images of Alexa-phalloidin (green) and anti-CS antibody (magenta) whole-mount stains of phenotypically wild-type sibling and ext2 mutant ears (Section 2). Blue arrowheads mark foci of chondroitin sulphate (CS) staining associated with the emergence (evagination) of epithelial projections from the otic epithelium; blue asterisks mark staining in the otolithic membrane overlying hair cells of the anterior (utricular) macula. Boxed areas highlight regions of interest (ROI), enlarged in the bottom row of panels: (i, v), apical focus of CS staining at 40 hpf, absent in the ext2 mutant, prefiguring site of emergence of the anterior projection in the wild-type ear; (ii, vi), foci of CS staining associated with the ventral projection at 48 hpf; (iii, vii), CS staining in the emerging ventral projection, delayed in the ext2 mutant; (iv, viii) no detectable staining in the wild-type posterior projection (iv) contrasts with strong staining in the unfused posterior projection in the ext2 mutant (viii). The boxed area in the lower left of (H, H’) is taken from a different focal plane in the stack to show the anterior (utricular) macula and otolithic membrane. All images are maximum intensity projections (MIPs) of between 3 and 10 selected z-slices, with the exception of the images at 40 hpf, which are single z-slices. All images are lateral views with anterior to left and dorsal to top (orientation shown in (A): A, anterior; D, dorsal). Scale bars, 50 µm. Abbreviation: CS, chondroitin sulphate.

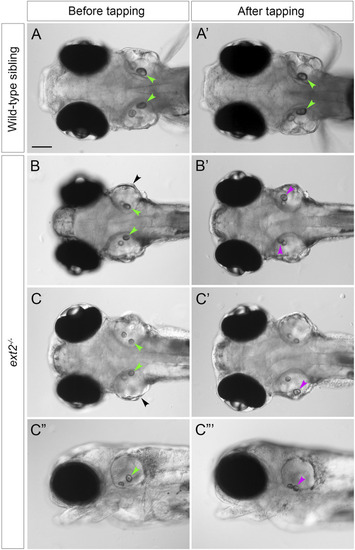
Saccular otoliths are not tethered correctly in the homozygous ext2 mutant ear at 5 dpf. (A–C”’) Live DIC images of embryos at 5 dpf, before (left-hand column) and after (right-hand column) tapping. In phenotypically wild-type sibling embryos (A,A’), saccular otoliths (green arrowheads) remain in place after tapping (in this example, one of the utricular otoliths in (A’) has become slightly displaced). In ext2 mutant embryos (B–D’), the saccular otolith in one or both ears becomes displaced (magenta arrowheads show new position after tapping). (A–C’) are dorsal views with anterior to the left; (C”,C”’) are lateral views of the embryo shown in (C,C’). Note also the swollen ear morphology in the ext2 mutants [(B,C), black arrowheads]. In all panels, anterior is to the left. Scale bar in (A), 100 μm (applies to all panels).

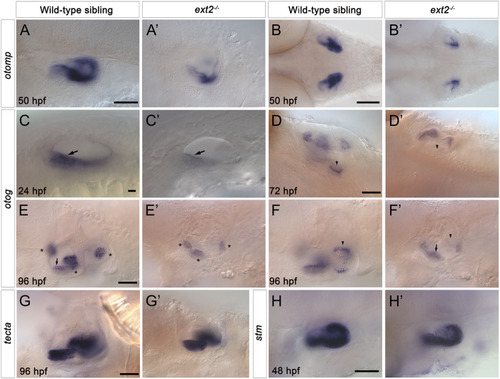
Expression of otomp, otog and stm is reduced in the saccular macula of the ext2−/− mutant ear. (A–H’)In situ hybridisation to otolith marker genes in the ears of phenotypically wild-type sibling and ext2 mutant embryos. (A–B’) Levels of otomp expression in the ext2 mutant ear (A’,B’) at 50 hpf were reduced compared with the wild type (A,B). (C–F’) Expression of otog at 24 hpf (C,C’), 72 hpf (D,D’), and 96 hpf (E-F’) was significantly reduced in the ext2 mutant ear. The images in (F,F’) show a more medial focal plane of the same ears depicted in (E,E’), respectively. (G,G’) Expression of tecta in the ext2 mutant ear was unaltered at 96 hpf. (H,H’) Expression of stm expression at 48 hpf was reduced in the posterior macula (arrowhead) of the ext2 mutant ear. Arrowheads mark the posterior (saccular) macula; arrows mark the anterior (utricular) macula; asterisks mark the cristae. All images are lateral views with anterior to the left, apart from (B,B’,D,D’) (dorsal views with anterior to the left). In all panels, anterior is to the left. Scale bars: in (A), 50 μm for (A’); in (B), 100 μm for (B’); in (C), 10 μm for (C’); in (D), 50 μm for (D’); in (E), 50 μm for (E’–F’); in (G), 50 μm for (G’); in (H), 50 μm for (H’).

Acknowledgments
This image is the copyrighted work of the attributed author or publisher, and ZFIN has permission only to display this image to its users. Additional permissions should be obtained from the applicable author or publisher of the image. Full text @ Front Cell Dev Biol