- Title
-
Identification of novel lipid biomarkers in xmrk- and Myc-induced models of hepatocellular carcinoma in zebrafish
- Authors
- Monroe, J.D., Fraher, D., Huang, X., Mellett, N.A., Meikle, P.J., Sinclair, A.J., Lirette, S.T., Maihle, N.J., Gong, Z., Gibert, Y.
- Source
- Full text @ Cancer Metab
|
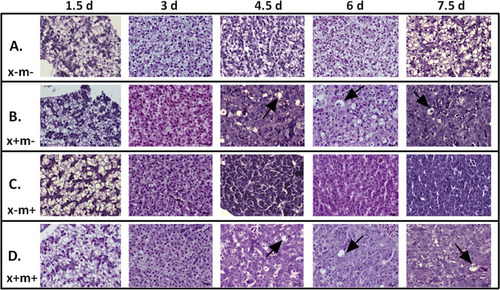
Induction of transgenes causes rapid oncogenic transformation of normal zebrafish liver cells into HCC cells. Representative histological cross sections of 3-month post-fertilization (mpf) DOX-treated zebrafish liver tissue from 1.5 to 7.5 dpt. Images were taken at 40× magnification. PHENOTYPE:
|
|
Lipid levels increase in zebrafish liver HCC tissue. Representative images of Oil-Red-O stained zebrafish tissue taken from three mpf DOX-treated zebrafish (1.5 to 7.5 dpt). Lipid droplets are stained in red and nuclei are counterstained in blue. PHENOTYPE:
|
|
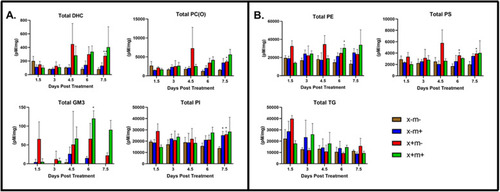
Total lipid class abundance during HCC transgene expression. Many lipid classes exhibited altered levels in three mpf DOX-treated zebrafish tissue samples from 1.5 to 7.5 dpt. PHENOTYPE:
|
|
Relative lipid class abundance changes in zebrafish liver tumor tissue. Abundance of 24 lipid classes in three mpf DOX-treated zebrafish from 1.5 to 7.5 dpt (see text for lipid class abbreviation definition). Key: x+m−, PHENOTYPE:
|
|
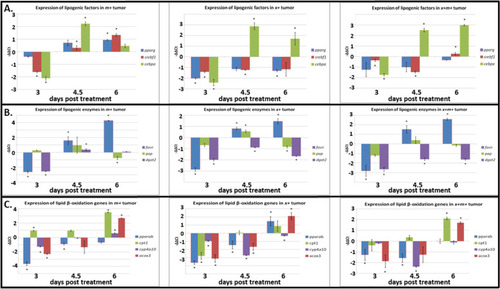
Expression profiles for lipid metabolism genes. The expression of lipogenic factors, enzymes, and lipid β-oxidation genes is altered in x−m+, x+m−, and x+m+ tumors at 3, 4.5, and 6 dpt. |
|
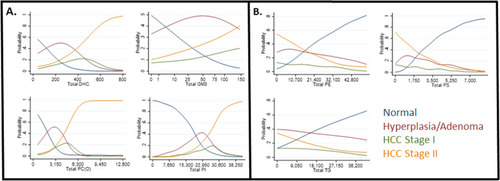
Total lipid class level association with HCC disease stage. Univariate modeling shows the probability that individual total lipid class levels are associated with normal or disease stage phenotypes. Plots show total lipid levels versus probability of disease progression. |


