
- Title
-
Establishment of Pancreatobiliary Cancer Zebrafish Avatars for Chemotherapy Screening
- Authors
- Tavares Barroso, M., Costa, B., Rebelo de Almeida, C., Castillo Martin, M., Couto, N., Carvalho, T., Fior, R.
- Source
- Full text @ Cells

Characterization and histological analysis of human pancreatic cancer zebrafish xenografts. Human Panc-1 cells were fluorescently labeled with DiI (magenta) and injected into the perivitelline space (PVS) of 2 days postfertilization (dpf) Tg (fli1:eGFP) zebrafish embryos (a–d). At 1 day post-injection (dpi), zebrafish xenografts with severe cardiac edema were discarded (a), and successfully injected xenografts (b) were divided according to their tumor size (+, ++, +++) and were kept at 34 °C until the end of the experiment. At 4 dpi, zebrafish xenografts were evaluated regarding the presence of tumor (% engraftment) (c,e), tumor size (f), and angiogenic capacity (d). Representative H&E-stained microphotographs of paraffin-embedded Panc-1 zebrafish xenografts at 4 dpi showing how Panc-1 cells implant in close proximity to the zebrafish pancreas, liver, and gut (g–j’). Scale bars represent 100 µm. (k–m) Representative confocal images of mitosis revealed by pHH3 staining (magenta) and DAPI (labeling condensed chromatin that enables detection of mitotic figures) and quantification of mitotic index—% mitotic figures and % pHH3 (n). All results are expressed as AVG ± SEM and correspond to at least 3 independent experiments. The number of zebrafish xenografts analyzed is indicated, and each dot represents one zebrafish xenograft. Scale bars represent 50 µm. All images are anterior to the left, posterior to right, dorsal up, and ventral down. |
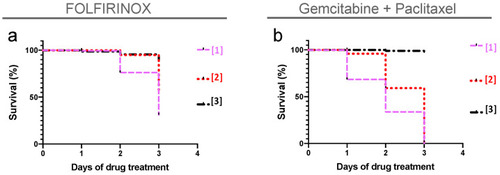
Maximum tolerated concentration (MTC) for FOLFIRINOX and gemcitabine + paclitaxel. Using as a reference the maximum patient’s plasma concentration of each compound (Table S1), we determined the zebrafish MTC. Noninjected embryos with 3 dpf were treated and replaced daily with different doses of chemotherapy for three consecutive days. (a) FOLFIRINOX [1] corresponds to 8.4 mM 5-FU + 0.36 mM folinic acid + 0.16 mM oxaliplatin + 0.16 mM irinotecan; FOLFIRINOX [2] corresponds to 6.3 mM 5-FU + 0.27 mM folinic acid + 0.12 mM oxaliplatin + 0.12 mM irinotecan; FOLFIRINOX [3] corresponds to 4.2 mM 5-FU + 0.18 mM folinic acid + 0.08 mM oxaliplatin + 0.08 mM irinotecan. (b) GnP [1] corresponds to 3.2 mM gemcitabine + 730 ng/mL paclitaxel; GnP [2] corresponds to 2.4 mM gemcibatine + 547.5 ng/mL paclitaxel; GnP [3] corresponds to 1.6 mM gemcitabine + 365 ng/mL paclitaxel. Due to the reduced mortality, the concentration [3] depicted in black was chosen for both combinations. |
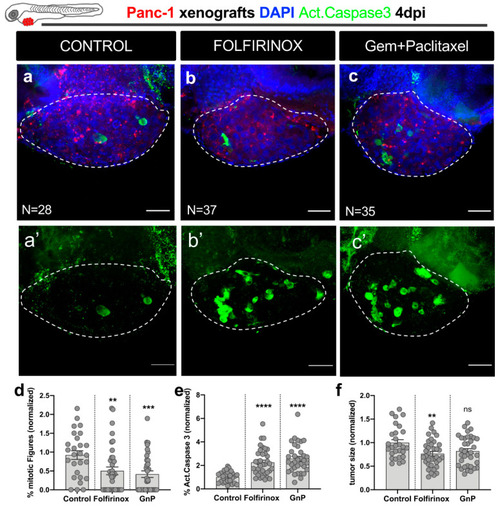
Zebrafish xenografts reveal sensitivity to the major therapeutic options for pancreatic cancer— FOLFIRINOX and gemcitabine plus paclitaxel chemotherapy. At 2 dpf, zebrafish embryos were injected with fluorescently labeled Panc-1 cells in the PVS. At 1 dpi, successfully injected xenografts were submitted to FOLFIRINOX or gem + paclitaxel treatment for three consecutive days and compared to control nontreated xenografts. At 4 dpi, zebrafish xenografts were imaged by confocal microscopy (a–c). Maximum Z projections of activated caspase-3 (a’–c’). Cell proliferation (% of mitotic figures), apoptotic index (% of activated caspase-3 in green), and tumor size (number of tumor cells, DAPI in blue) were analyzed and quantified (d–f, respectively). Data are shown as mean ± SEM. Statistical analysis was performed using Mann–Whitney test. Statistical results: (ns) > 0.05, ** p ≤ 0.01, *** p ≤ 0.001, **** p ≤ 0.0001. The number of zebrafish xenografts analyzed is indicated in the figure. Results are from 3 independent experiments. Scale bars represent 50 µm. All images are anterior to the left, posterior to right, dorsal up, and ventral down. |
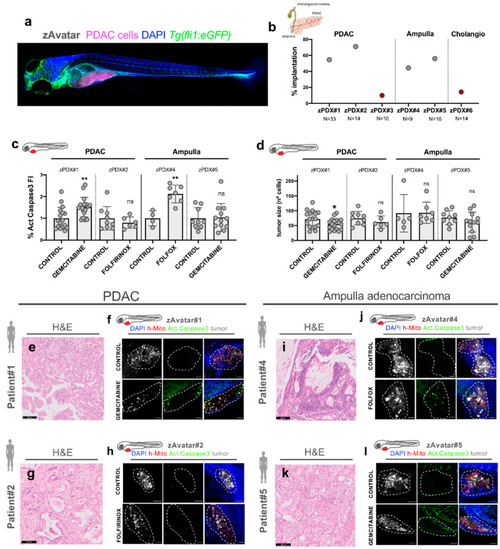
zAvatars generated from different histological pancreatobiliary tumors. For all examples, cells were extracted from the surgical resected sample, injected in 2dpf embryos, and tested for chemotherapy schemes. At 3 dpi and 2 days post-treatment (2 dpT), zAvatars were sacrificed and fixed, subjected to whole-mount immunofluorescence and imaged by confocal fluorescent microscopy. (a) Confocal image representative of a zAvatar injected with PDAC cells (labeled in magenta) in a Tg (fli1:eGFP) zebrafish background (labeled in green) at 3 dpi. (b) Percentage of engraftment of the different zAvatars; the total number of xenografts analyzed at the end of the assay is depicted in the figure. (c) Quantification of the apoptotic index (fold induction of activated caspase-3). (d) Quantification of the tumor size (fold change of the number of tumor cells). All results are expressed as AVG ± SEM. Statistical analysis was performed using Mann–Whitney test. Statistical results: (ns) > 0.05, * p ≤ 0.05, ** p ≤ 0.01. Each dot represents one zAvatar. (e,g,i,k) Hematoxylin and eosin staining of Patient #1, #2, #4, and #5 pathology samples, respectively. Scale bars represent 100 µm. (f,h,j,l) Representative confocal images of control and treatment zAvatars #1, #2, #4, and #5, respectively. Note that only zAvatar #5 is a Tg (fli1:eGFP), where zebrafish blood vessels can be detected in green. Scale bars represent 50 µm. For all images, tumor cells are labeled in white, activated caspase-3 in green, human mitochondria in red, and DAPI in blue. All images are anterior to the left, posterior to right, dorsal up, and ventral down. |