
Figure 3
- ID
- ZDB-FIG-210902-174
- Publication
- Tavares Barroso et al., 2021 - Establishment of Pancreatobiliary Cancer Zebrafish Avatars for Chemotherapy Screening
- Other Figures
- All Figure Page
- Back to All Figure Page
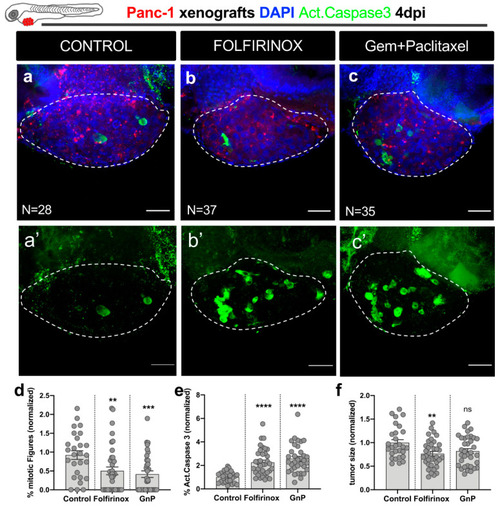
Zebrafish xenografts reveal sensitivity to the major therapeutic options for pancreatic cancer— FOLFIRINOX and gemcitabine plus paclitaxel chemotherapy. At 2 dpf, zebrafish embryos were injected with fluorescently labeled Panc-1 cells in the PVS. At 1 dpi, successfully injected xenografts were submitted to FOLFIRINOX or gem + paclitaxel treatment for three consecutive days and compared to control nontreated xenografts. At 4 dpi, zebrafish xenografts were imaged by confocal microscopy (a–c). Maximum Z projections of activated caspase-3 (a’–c’). Cell proliferation (% of mitotic figures), apoptotic index (% of activated caspase-3 in green), and tumor size (number of tumor cells, DAPI in blue) were analyzed and quantified (d–f, respectively). Data are shown as mean ± SEM. Statistical analysis was performed using Mann–Whitney test. Statistical results: (ns) > 0.05, ** p ≤ 0.01, *** p ≤ 0.001, **** p ≤ 0.0001. The number of zebrafish xenografts analyzed is indicated in the figure. Results are from 3 independent experiments. Scale bars represent 50 µm. All images are anterior to the left, posterior to right, dorsal up, and ventral down. |