
Figure 2
- ID
- ZDB-FIG-210902-173
- Publication
- Tavares Barroso et al., 2021 - Establishment of Pancreatobiliary Cancer Zebrafish Avatars for Chemotherapy Screening
- Other Figures
- All Figure Page
- Back to All Figure Page
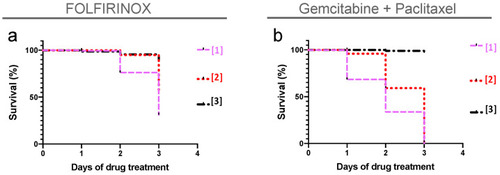
Maximum tolerated concentration (MTC) for FOLFIRINOX and gemcitabine + paclitaxel. Using as a reference the maximum patient’s plasma concentration of each compound (Table S1), we determined the zebrafish MTC. Noninjected embryos with 3 dpf were treated and replaced daily with different doses of chemotherapy for three consecutive days. (a) FOLFIRINOX [1] corresponds to 8.4 mM 5-FU + 0.36 mM folinic acid + 0.16 mM oxaliplatin + 0.16 mM irinotecan; FOLFIRINOX [2] corresponds to 6.3 mM 5-FU + 0.27 mM folinic acid + 0.12 mM oxaliplatin + 0.12 mM irinotecan; FOLFIRINOX [3] corresponds to 4.2 mM 5-FU + 0.18 mM folinic acid + 0.08 mM oxaliplatin + 0.08 mM irinotecan. (b) GnP [1] corresponds to 3.2 mM gemcitabine + 730 ng/mL paclitaxel; GnP [2] corresponds to 2.4 mM gemcibatine + 547.5 ng/mL paclitaxel; GnP [3] corresponds to 1.6 mM gemcitabine + 365 ng/mL paclitaxel. Due to the reduced mortality, the concentration [3] depicted in black was chosen for both combinations. |