
- Title
-
ubtor Mutation Causes Motor Hyperactivity by Activating mTOR Signaling in Zebrafish
- Authors
- Wang, T., Zhou, M., Zhang, Q., Zhang, C., Peng, G.
- Source
- Full text @ Neurosci. Bull.
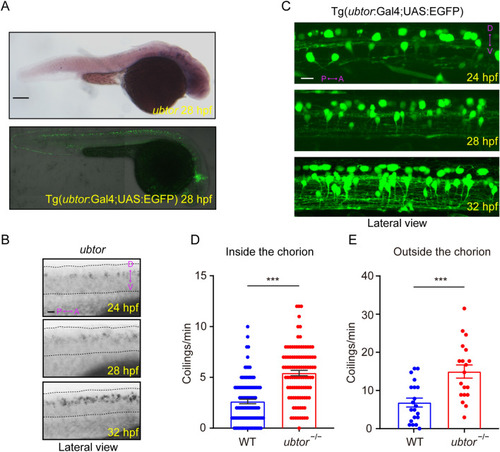
ubtor is expressed in spinal interneurons and ubtor mutants show increased spontaneous coiling. A ubtor expression (upper) and EGFP expression (lower) in 28-hpf Tg(ubtor:GAL4;UAS:EGFP) zebrafish embryos (scale bar, 250 μm). B Expression and distribution of the ubtor gene in zebrafish embryo spinal cord tissues at 24, 28, and 32 hpf (dotted lines, spinal cord tissue from hindbrain to somite 20. Scale bar, 60 μm. C EGFP expression in the spinal cord tissue of embryos at somites 4–10 of the Tg(ubtor:GAL4;UAS:EGFP) line (scale bar, 20 μm). D Frequency of coiling movements of embryos inside the chorion of 28-hpf ubtor mutants and the wild-type (results from five biological repeats, NWT = Nubtor−/− = 126, t198 = 8.097). E Frequency of coiling movements outside the chorion of 28-hpf ubtor mutants and the wild-type (two biological repeats, NWT = Nubtor−/− = 20, t37 = 3.914). Values are represented as the mean ± SEM in D and E. ***P <0.001; P, posterior; A, anterior; D, dorsal; V, ventral. |
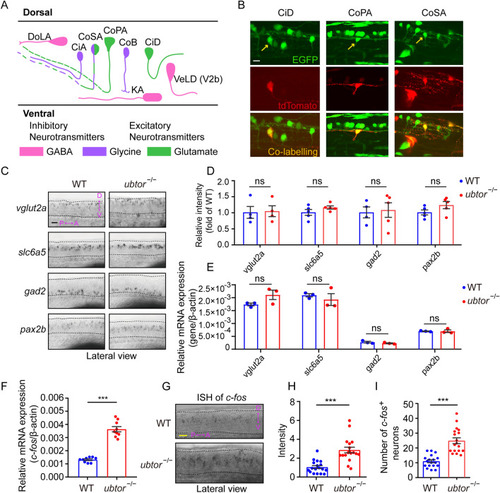
ubtor mutants show increased activity in spinal interneurons. A Schematic of different types of spinal interneurons (modified from [20]). B Mosaic labeling of spinal interneurons by tdTomato in 28-hpf Tg(ubtor:GAL4;UAS:EGFP) transgenic embryos (scale bar, 20 μm). Arrows indicate mosaic labelling interneurons. C Expression and distribution of spinal interneuron markers in spinal somites 4–10 (scale bar, 60 μm). D Quantification of relative intensity of spinal interneuron markers (vglut2a: NWT = Nubtor−/− = 5, t6 = 0.150; slc6a5: NWT = Nubtor−/− = 5, t8 = 1.462; gad2: NWT = Nubtor−/− = 5, t7 = 0.2453; pax2b: NWT = Nubtor−/− = 5, t8 = 1.662). E RT-qPCR analyses of expression levels of spinal interneuron markers in the trunk tissues of 28-hpf embryos (three biological repeats, each marker: NWT = Nubtor−/− = 75). F RT-qPCR analysis of c-fos expression levels in the trunk tissues of 28-hpf embryos (three biological repeats, NWT = Nubtor−/− = 75, t16 = 10.99). G Expression and distribution of c-fos in spinal somites 4–10 (scale bar, 40 μm). H Intensity of c-fos-labeled neurons in spinal cord (two biological repeats, NWT = Nubtor−/− = 18, t34 = 5.348). I Numbers of c-fos labeled neurons in spinal cord (two biological repeats, NWT = Nubtor−/− = 18, t34 = 6.324). β-actin served as the internal control. Values are represented as the mean ± SEM. In D–F, H, and I, ***P <0.001. Abbreviations: DoLA, dorsal longitudinal ascending; CiA, circumferential ascending; CoSA, commissural secondary; CoPA, commissural primary ascending; CoB, commissural bifurcating; KA, Kolmer-Agduhr; CiD, circumferential descending; VeLD, ventral longitudinal descending. |
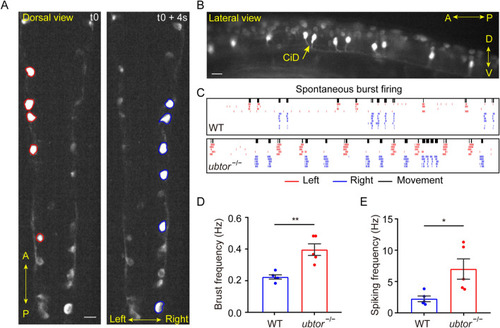
Calcium imaging of spinal interneurons. A Representative Ca2+ signals of spinal cord interneurons. At t0 (an arbitrary time point in the video sequence), interneurons on the left side are firing, followed by interneurons on the right side 4 s later (dorsal view; scale bar, 40 μm). B Firing interneurons are CiD interneurons; the Ca2+ signal lights up the soma and the descending axons of CiD interneurons during a burst (lateral view, scale bar, 40 μm). C Rasters of correlated muscle movements and neuronal bursts (black bars, muscle movements; red and blue lines, left and right interneuron spikes estimated by the MLspike method). D, E Quantitative analysis of neuronal burst frequency (NWT = Nubtor−/− = 5, t8 = 4.396; D and spike frequency (NWT = Nubtor−/− = 5, t8 = 2.821; E of spinal interneurons. Values are represented as the mean ± SEM in D and E. *P <0.05, **P <0.01. |
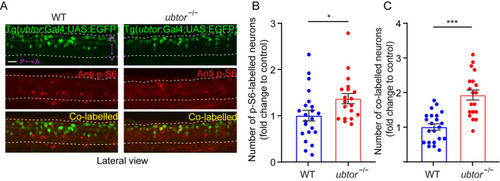
mTORC1 hyperactivation in the spinal interneurons of ubtor mutant embryos. A p-S6 staining and EGFP signals in 28-hpf embryos (dotted lines outline spinal somites 4–10; scale bar, 40 μm). B Numbers of p-S6-labelled neurons in the spinal cord of 28-hpf embryos (three biological repeats, NWT = 22, Nubtor−/− = 19, t39 = 5.538). C Numbers of co-labeled p-S6/EGFP neurons in the spinal cord of 28-hpf embryos (three biological repeats, NWT = 22, Nubtor−/− = 19, t39 = 2.265). Values are represented as the mean ± SEM in B and C. *P <0.05, ***P <0.001. |

Rapamycin normalizes spontaneous movements and the activity of spinal interneurons in 28-hpf ubtor mutant embryos. A p-S6 staining in the spinal cord of 28-hpf embryos treated with DMSO (solvent) or 100 nmol/L rapamycin (dashed lines, spinal somites 4–10; scale bar, 40 μm). B Immunoblotting for p-S6 and S6 protein in 28-hpf embryos treated with DMSO or 100 nmol/L rapamycin. Quantified p-S6 protein levels are indicated. C Frequency of coiling movements outside the chorion of 28-hpf embryos treated with DMSO or rapamycin (two biological repeats, DMSO: NWT = Nubtor−/− = 16, t29 = 2.974; rapamycin: NWT = Nubtor−/− = 16, t29 = 0.189). D RT-qPCR analysis of c-fos mRNA levels in 28-hpf embryos treated with DMSO or rapamycin (three biological repeats, DMSO: NWT = Nubtor−/− = 75, t16 = 11.57; rapamycin: NWT = Nubtor−/− = 75, t16 = 1.389). E Expression and distribution of c-fos using in situ hybridization assays in 28-hpf embryos treated with DMSO or 100 nmol/L rapamycin (spinal somites 4–10; scale bar, 40 μm). F, G Relative intensity (DMSO: NWT = 8, Nubtor−/− = 10, t16 = 4.246; rapamycin: NWT = 6, Nubtor−/− = 9, t12 = 1.586; F) and number (DMSO: NWT = 8, Nubtor−/− = 10, t16 = 3.520; rapamycin: NWT = 6, Nubtor−/− = 9, t12 = 1.453; G) of c-fos labeled spinal interneurons in 28-hpf embryos treated with DMSO or rapamycin. β-actin served as thein ternal control. Values are represented as the mean ± SEM in C, D, F, and G. **P <0.01, ***P <0.001. |

ubtor mutants exhibit hypersensitivity to PTZ. A, B Locomotion tracks A and movement velocity B of 4-dpf larvae treated with water (solvent) (three biological repeats, NWT = Nubtor−/− = 36, t128 = 0.737) or 3 mmol/L PTZ (three biological repeats, NWT = Nubtor−/− = 36, t128 = 4.753) in a 10-min period. C Immunoblotting for p-S6 protein in 4-dpf larvae treated with water or PTZ. Values of p-S6 protein levels are indicated. D Expression and distribution of c-fos mRNA in brain tissue of 4-dpf larvae treated with solvent (water) or PTZ (scale bar, 100 μm). E RT-qPCR analysis of c-fos mRNA levels in brain and spinal tissues of 4-dpf larvae treated with control or PTZ (three biological repeats, control: NWT = Nubtor−/− = 75; 3 mmol/L PTZ:NWT = Nubtor−/− = 75). β-actin served as the internal control. Values are represented as the mean ± SEM in B and E. *P <0.05, ***P <0.001. |

Rapamycin rescues seizure susceptibility in PTZ-induced ubtor mutant larvae. A, B Locomotion tracks A and movement velocity B of 4-dpf larvae pre-treated with DMSO (NWT = Nubtor−/− = 24, t39 = 2.987) or 2 µmol/L rapamycin (NWT = Nubtor−/− = 24, t38 = 0.365), followed by 3 mmol/L PTZ (two biological repeats).C Immunoblotting for p-S6 protein in 4-dpf larvae treated as in A. Values of p-S6 protein levels are indicated. D Expression and distribution of c-fos mRNA in brain tissue of 4-dpf larvae treated with rapamycin and PTZ (scale bar, 100 μm). E RT-qPCR analysis of c-fos mRNA levels in the brain and spinal tissues of 4-dpf larvae treated with control or rapamycin, followed by 3 mmol/L PTZ (three biological repeats, control: NWT = Nubtor−/− = 75; rapamycin: NWT = Nubtor−/− = 75). β-actin served as the internal control. Values are represented as the mean ± SEM in B and E. **P <0.01, ***P <0.001. |