
|
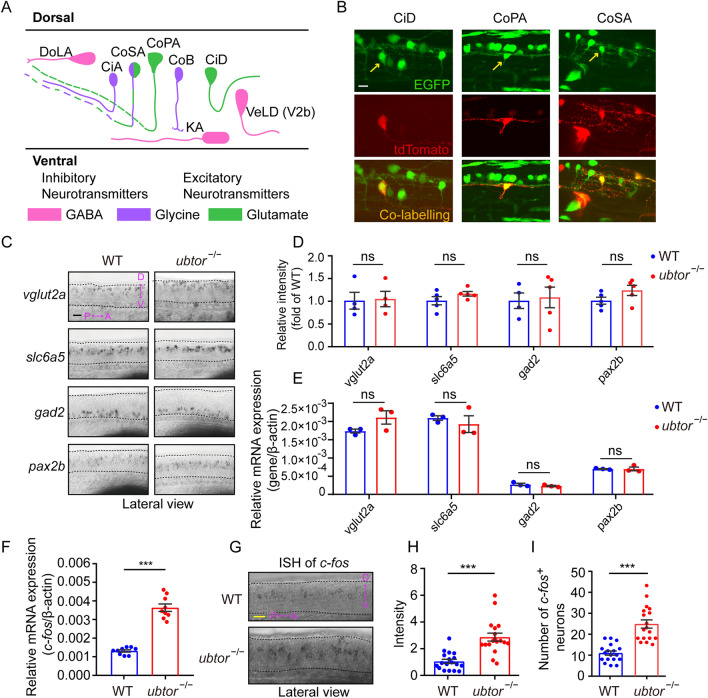
Fig. 2
ubtor mutants show increased activity in spinal interneurons. A Schematic of different types of spinal interneurons (modified from [20]). B Mosaic labeling of spinal interneurons by tdTomato in 28-hpf Tg(ubtor:GAL4;UAS:EGFP) transgenic embryos (scale bar, 20 μm). Arrows indicate mosaic labelling interneurons. C Expression and distribution of spinal interneuron markers in spinal somites 4–10 (scale bar, 60 μm). D Quantification of relative intensity of spinal interneuron markers (vglut2a: NWT = Nubtor−/− = 5, t6 = 0.150; slc6a5: NWT = Nubtor−/− = 5, t8 = 1.462; gad2: NWT = Nubtor−/− = 5, t7 = 0.2453; pax2b: NWT = Nubtor−/− = 5, t8 = 1.662). E RT-qPCR analyses of expression levels of spinal interneuron markers in the trunk tissues of 28-hpf embryos (three biological repeats, each marker: NWT = Nubtor−/− = 75). F RT-qPCR analysis of c-fos expression levels in the trunk tissues of 28-hpf embryos (three biological repeats, NWT = Nubtor−/− = 75, t16 = 10.99). G Expression and distribution of c-fos in spinal somites 4–10 (scale bar, 40 μm). H Intensity of c-fos-labeled neurons in spinal cord (two biological repeats, NWT = Nubtor−/− = 18, t34 = 5.348). I Numbers of c-fos labeled neurons in spinal cord (two biological repeats, NWT = Nubtor−/− = 18, t34 = 6.324). β-actin served as the internal control. Values are represented as the mean ± SEM. In D–F, H, and I, ***P <0.001. Abbreviations: DoLA, dorsal longitudinal ascending; CiA, circumferential ascending; CoSA, commissural secondary; CoPA, commissural primary ascending; CoB, commissural bifurcating; KA, Kolmer-Agduhr; CiD, circumferential descending; VeLD, ventral longitudinal descending.