- Title
-
The recycling endosome protein Rab25 coordinates collective cell movements in the zebrafish surface epithelium
- Authors
- Willoughby, P.M., Allen, M., Yu, J., Korytnikov, R., Chen, T., Liu, Y., So, I., Macpherson, N., Mitchell, J.A., Fernandez-Gonzalez, R., Bruce, A.E.E.
- Source
- Full text @ Elife
|
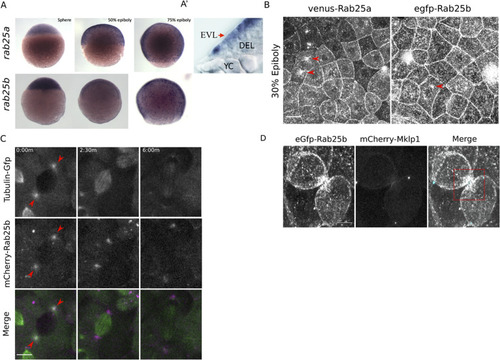
(A) Bright field images of whole-mount in situ hybridizations for rab25a (top row) and rab25b (bottom row), in WT embryos; lateral views with animal pole positioned to the top. (A’) Section of a WT embryo showing rab25a expression restricted to the EVL (arrow, top row far right panel); transcripts absent from the deep cells (DEL) and yolk cell (YC). (B) Confocal z-projections of Venus-Rab25a and eGfp-Rab25b subcellular localization in WT embryos; red arrowheads denote perinuclear aggregates. Scale bar 20 μm. (C) Confocal z-projections of stills from time-lapse movies of transgenic Tubulin-GFP (green) embryos expressing mCherry-Rab25b (magenta). Arrowheads denote co-localization of mCherry-Rab25b at centrosomes. Scale bar 20 μm. (D) Confocal z-projections of eGfp-Rab25b (white) and mCherry-Mklp1 (teal) localization in WT embryos; box highlights enrichment of eGfp-Rab25b adjacent to the midbody. Scale bar 20 μm. EXPRESSION / LABELING:
|
|
( |
|
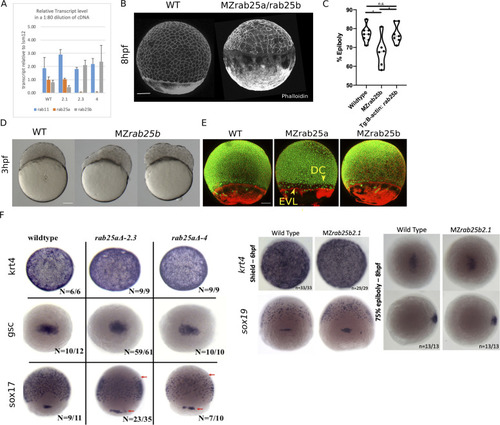
(A) Time-matched bright field images of lateral views of WT, MZrab25a and MZrab25b embryos during epiboly. Arrowheads indicate blastoderm margin, asterisks denote embryonic organizer (shield). (B) Quantification of epiboly progression after 8hpf in: WT (n = 80), MZrab25a (2.3, n = 87), MZrab25a (4,n = 28); WT (n = 97), Mrab25a (2.3,n = 73), MZrab25a (4,n = 49); WT (n = 29), MZrab25b (n = 21), Mrab25b (n = 18). Means: SEM; Two-Way ANOVA; ***p<0.001, ****p<0.0001.(N = 3). (C) Confocal z-projections of time-matched lateral views of WT, MZrab25a and MZrab25b embryos at 8hpf stained with phalloidin and corresponding apical surface area heat maps. Cooler colors represent smaller areas, warmer colors represent larger areas. Yellow boxes indicate cells with reduced apices. Red arrows denote cells with increased apical surface areas. White arrows indicate curved cell junctions. Scale bar 100 μm. (D) Frequency distribution of apical surface areas of WT (n = 817, N = 8), MZrab25a 2.3 (n = 651, N = 14), MZrab25a 4 (n = 654, N = 15) and MZrab25b (n = 503, N = 15) embryos at 6hpf. (E) EVL Cell number in WT (n = 8), MZrab25b (n = 8), MZrab25a 2.3 (n = 9) and MZrab25a 4 (n = 7) embryos at 6hpf. Means: SEM; Two-Way ANOVA; ***p<0.001. (F) Frequency distributions of EVL cellular contacts number at 6hpf in WT (n = 817, N = 8), MZrab25a 2.3 (n = 651, N = 14), MZrab25a 4 (n = 654, N = 15) and MZrab25b (n = 503, N = 15). (G) Circularity quantifications for WT and MZrab25b embryos during epiboly. 30% epiboly: WT (n = 7), Mrab25b (n=7). Shield: WT (n=14), Mrab25b (n=10). 80% epiboly: WT (n=8), Mrab25b (n=9). Means: SEM: One-way ANOVA, ****p<0.0001. PHENOTYPE:
|
|
( EXPRESSION / LABELING:
PHENOTYPE:
|
|
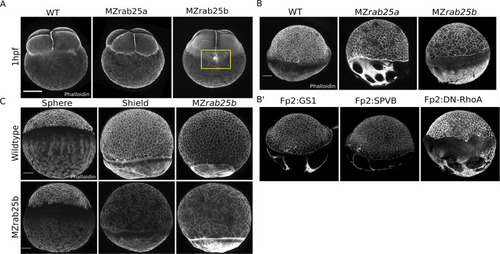
(A) Time-matched phalloidin stained WT, MZrab25a, and MZrab25b embryos at 1hpf; Yellow box shows disorganized cortical actin network. Scale bar 100 μm. (B,B’) EVL morphology does not resemble mutant embryos when WT yolk cell F-actin networks are perturbed. Stage-matched embryos positioned laterally at 6hpf stained with phalloidin. Scale bar 100 μm. (C) EVL defects emerge over the duration of epiboly in MZrab25b mutant embryos. Stage-matched WT and MZrab25b embryos positioned laterally stained with phalloidin. Scale bar 100 μm. |
|
( PHENOTYPE:
|
|
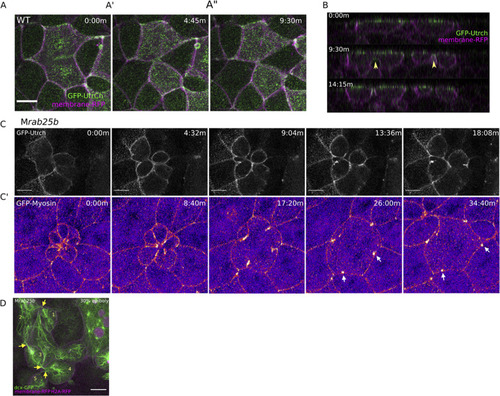
(A–A”) Confocal z-projections of stills from time-lapse of a WT EVL cell during mitosis expressing Gfp-Utrophin (green) and mRfp (magenta). Scale bar 20 μm. (B) Lateral views with apical to the top of stills from single-plane confocal time-lapses of WT EVL cells during mitosis expressing Gfp-Utrophin (green) and mRfp (magenta). Arrowheads denote cleavage furrow ingression from basal to apical. (C) Confocal z-projections of stills from time-lapse of MZrab25b multipolar cleavage failure. F-actin labeled with Gfp-Utrophin. Scale bar 20 μm. (C’) Confocal z-projections of time-lapse of MZrab25b Tg (Myl1.1-Gfp) (Fire-LUT) during multipolar cytokinesis failure. White arrows indicate Myosin-Gfp foci. (D) Confocal z-projection of MZrab25b embryo showing an array of EVL cells interconnected via cytokinetic bridges at 30% epiboly. Microtubules (green), nuclei (magenta), and plasma membrane (magenta), arrows and numbers denote connected cells and cytokinetic bridges. Scale bar 20 μm. PHENOTYPE:
|
|
( PHENOTYPE:
|
|
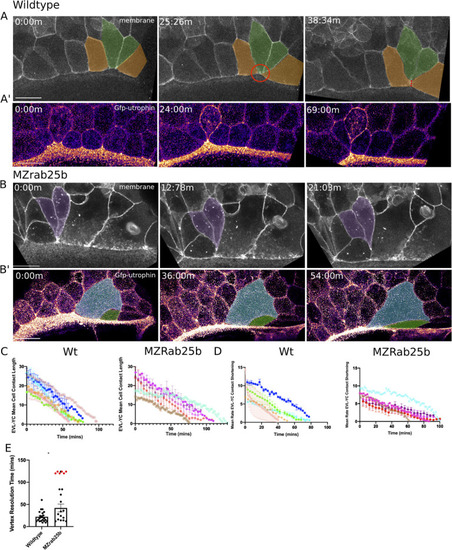
(A) Confocal z-projections of stills from a time-lapse of a WT embryo expressing mGfp starting at 7hpf. Lateral view focused on the margin. Green shaded cells shrink the EVL-YC junction and intercalate into submarginal zones. Orange shaded cells establish new cell-cell contacts following intercalation events (denoted by red dotted line). Circle denotes shared vertex with underlying yolk cell. Scale bar 20 μm (A’) Confocal z-projection time-lapse of WT embryo labeled for F-actin; (Fire-LUT) (Gfp-Utrophin) starting at 7hpf; lateral view; scale bar 20 μm. (B) Confocal z-projection of stills from a confocal time-lapse starting at 7hpf of an MZrab25b embryo expressing membrane-Gfp. Purple shaded cells exit EVL marginal region. Scale bar 20 μm (B’) Confocal z-projection of stills from time-lapse starting at 7hpf of an MZrab25b embryo labeled for F-actin (Fire-LUT) (Gfp-Utrophin); scale bar 20 μm. Shaded cells denote an EVL circumferential stretching event. Scale bar 20 μm. (C–D) EVL-YC mean contact length or shortening rate over time in rearranging EVL marginal cells in WT (N = 5) and MZrab25b embryos (N = 5). Mean:SEM. Each color indicates a separate trial of a single embryo. Each line represents the average of the contact length or junction shrink rate in each trial (n = 2–5). (E) Resolution times following formation of EVL-YC multicellular vertices. Mean: SEM. WT (n = 20,N = 4) and MZrab25b (n = 12,N = 5), unresolved MZrab25b vertices (red) (n = 6,N = 5). Mann-Whitney, *p<0.05. PHENOTYPE:
|
|
( |
|
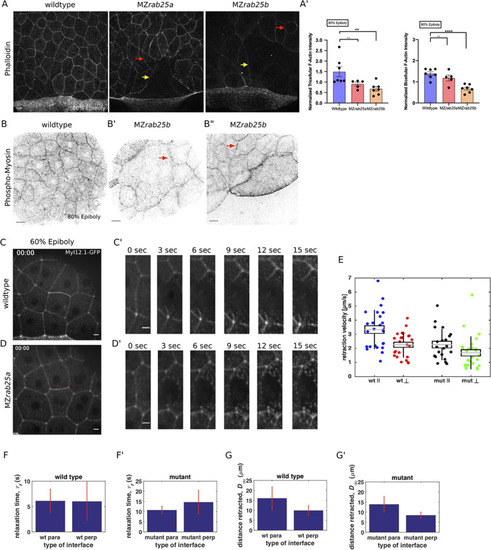
(A) Lateral views with animal pole to the top of z-confocal projections of phalloidin stained WT, MZrab25a and MZrab25b embryos stage-matched at 80% epiboly; red arrows show reduced cortical actin in normal sized cells; yellow arrows show reduced actin in large cells; Scale bar 20 μm. (A’) Quantification of normalized tricellular and bicellular F-actin intensity at 80% epiboly. WT (n = 90,N = 9), MZrab25a (n = 90,N = 9) and MZrab25b (n = 90,N = 9). Means: SEM; Mann-Whitney, **,p<0.001. (B) Confocal z-confocal projections of WT and MZrab25b embryos at 80% epiboly antibody stained for pMyosin. Red arrows denote uneven distribution of pMyosin along individual MZrab25b cellular junctions. Scale bar 20 μm. (C–D’) Confocal z-confocal projections of WT or MZrab25a Tg(Myl1.1-Gfp) at 60% epiboly; lateral positioned embryo focused on EVL margin; red line marks the ablated junction. Scale bar 5 μm. (E–G’) Initial recoil velocity, relaxation time and distance retracted in WT and MZrab25a embryos following junction laser cutting (see Materials and methods). WT and MZrab25a perpendicular and parallel cuts (n = 26,23);(n = 21,25). EXPRESSION / LABELING:
PHENOTYPE:
|
|
( PHENOTYPE:
|
|
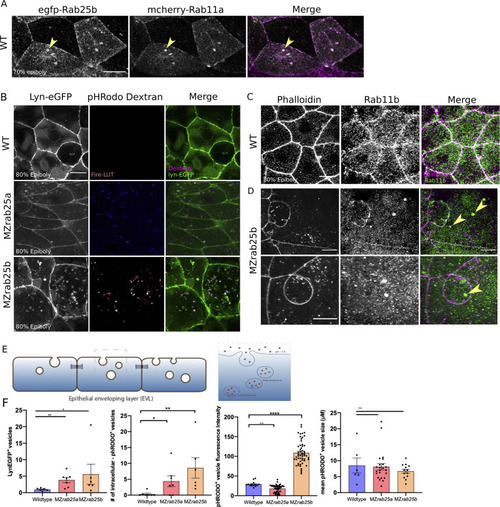
(A) z-projection stills of a wild-type embryo at 80% epiboly co-expressing mCherry-Rab11a (green) and eGfp-Rab25b (magenta); arrowhead denotes overlap. (B) Live WT, MZrab25a and MZrab25b embryos expressing Lyn-eGfp (green) and containing cytoplasmic pHRodo dextran puncta (magenta) following incubation. Scale bar 20 μm. (C,D) Rhodamine phalloidin stained (magenta) and Rab11b antibody (green) stained WT and MZrab25b embryos at 80% epiboly; arrowheads denote large Rab11b endosomes. Scale bar 20 μm (E) Schematic of pHRodo dextran apical endocytosis (F) Mean number of Lyn-eGfp- or pHRodo-positive vesicles/cell. WT, MZrab25a and MZrab25b embryos (N = 7,7,6). Fluorescence intensity measured over a 1 μm line in pHRodo-positive vesicles; WT (n = 15); MZrab25a (n = 46); MZrab25b (n = 54). Mean surface area of pHRodo vesicles; WT(n = 6); MZrab25a and MZrab25b (n = 23,13). Means: SEM; significance using Mann-Whitney test. Scale bars, (A–C) 20 μm. PHENOTYPE:
|
|
( |
|
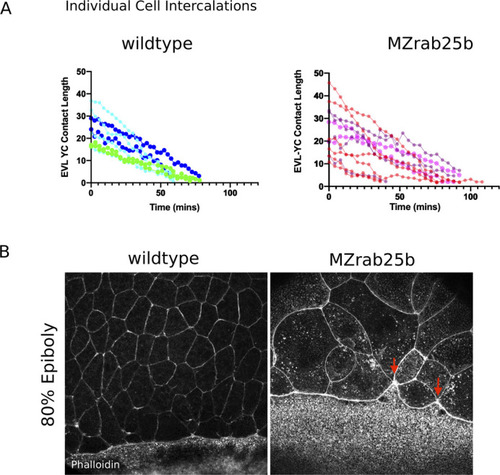
Means: SEM;t-test,*, p<0.05. PHENOTYPE:
|

