FIGURE SUMMARY
Title

A Zebrafish Model of Retinitis Pigmentosa Shows Continuous Degeneration and Regeneration of Rod Photoreceptors

Authors
Santhanam, A., Shihabeddin, E., Atkinson, J.A., Nguyen, D., Lin, Y.P., O'Brien, J.
Source
Full text @ Cells

P23H mutant rhodopsin transgene construct. Mouse rhodopsin carrying the P23H mutation and a C-terminal Flag tag is driven by a 1.8 kb Zebrafish rhodopsin promoter.

Expression of P23H Flag-tagged rhodopsin at early stages of photoreceptor development in wild type (WT) and P23H transgenic (P23H) zebrafish. Expression of P23H mutant rhodopsin (Flag; red) and rhodopsin (Retp1; green) at 2 dpf (A,B), 3 dpf (C,D), 5 dpf (E,F), 7 dpf (G,H), and 9 dpf (I,J). Expression of Flag-tagged P23H mutant rhodopsin (red) compared to double cones (Zpr1, green) at 2 dpf (K,L), 3 dpf (M,N), 5 dpf (O,P), 7 dpf (Q,R), and 9 dpf (S,T). Yellow arrowheads denote cells expressing P23H mutant rhodopsin. Nuclei labeled with DAPI are blue. ONL: outer nuclear layer; INL: inner nuclear layer. Scale bar in L applies to all panels.

Expression of P23H Flag-tagged rhodopsin in adult zebrafish retina. (A,B) The Flag-tagged P23H mutant rhodopsin (red) is expressed by sparsely-distributed photoreceptors in the adult fish (B); there is no labeling in wild type fish (A). (C,D) Mutant rhodopsin (red) colocalizes with rhodopsin (Retp1, green) in the rods. (E,F) Mutant rhodopsin (red) is expressed only by the rods and not the cones, as seen with the cone marker Zpr1 (green). Yellow arrowheads represent the cone axons and yellow arrows represent the cone myoids. ONL: outer nuclear layer; INL: inner nuclear layer; OS: outer segments. Scale bar in B applies to all panels.

Photoreceptor loss in the P23H transgenic zebrafish. DAPI label of adult retina sections. The yellow dotted lines encompass nuclei in the ONL counted to assess photoreceptor loss. OS indicates the space between photoreceptor myoids and retinal pigmented epithelium. The number of cells in the ONL is almost three times greater in the WT (A) than in the P23H mutant (B), which usually shows a single irregular layer of nuclei. (C) Quantification of photoreceptor counts in WT and P23H transgenic (n = 6 fish per genotype; error bars are ± SD; ** p < 0.01). (D) Quantification of OS length in WT and P23H transgenic (n = 6 fish per genotype; error bars are ± SD; ** p < 0.01). Scale bar in B applies to A and B.

PHENOTYPE:
Fish:
Observed In:
Stage: Adult

Cell death and cell proliferation in the P23H transgenic zebrafish. (A,B) Cell death detection using TUNEL staining shows TUNEL-positive dying cells (red) in the P23H zebrafish retina (4 months old). The yellow arrowhead shows a TUNEL-positive cell in the sub-retinal space. (C,D) Yellow arrowheads show the colocalization of Retp1 (green) with TUNEL labeling in the P23H transgenic fish. (E,F) PCNA immunostaining shows many PCNA-positive proliferating cells (green) in the ONL of the P23H zebrafish, but very few in WT. ONL: outer nuclear layer. (G) Numbers of TUNEL positive cells and (H) PCNA-positive cells per 210 µm image field in 4-month old and 6-month old WT and P23H retina (n = 6 fish per genotype; error bars are ± SD; *** p < 0.001).

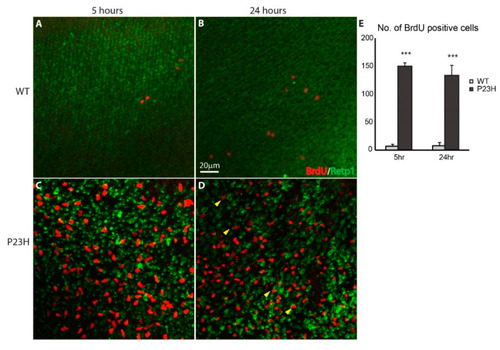
Continuous cell proliferation in the P23H transgenic zebrafish. Wholemount imaging of BrdU (red) labeled cells in ONL of the WT (A,B) and P23H transgenic (C,D) 5 and 24 h after BrdU injection respectively. Retp1 (green) labels rhodopsin. Yellow arrowheads in panel D show BrdU-labeled cells that co-label with Retp1, indicating their differentiation into rods. Scale bar in B applies to A–D. (E) The number of BrdU-labeled cells in the P23H transgenic fish is significantly higher than in the WT (n = 3 fish per genotype; error bars are ± SD; *** p < 0.001).

Bipolar cell synapses in P23H transgenic retina. (A,B) Immunolabeling for PKC-α (red) shows that rod bipolar cells are morphologically similar, but PKC-α labeling is less intense in the P23H transgenic (B) compared to WT (A). Yellow arrowheads indicate the bipolar cell axons. (C) Relative mRNA level of PKC-α is higher in the WT compared to the P23H (n = 3 fish per genotype; error bars are ± SD; * p < 0.05). (D,E) Enlarged images show the synaptic contacts made by PKC-labeled bipolar cells with rod and cone photoreceptor terminals labeled for SV2 (green). Fine synaptic contacts onto rods are shown with yellow arrowheads. Bipolar cells appear to contact some of the rods expressing the P23H rhodopsin (magenta) (E). ONL: outer nuclear layer; INL: inner nuclear layer; OPL: outer plexiform layer.

EXPRESSION / LABELING:
Gene:
Antibody:
Fish:
Anatomical Terms:
Stage: Adult
PHENOTYPE:
Fish:
Observed In:
Stage: Adult

Glutamine synthetase (Glul) immunostaining is weak in the P23H transgenic fish. (A,B) Immunolabeling for Glul (red) shows the overall intensity of Glul is weak in the P23H compared to WT. The top and side yellow boxes on each panel show the and X and Y maximum intensity orthogonal projections, respectively. Glul immunostaining is much weaker in the OPL and outer ONL of P23H transgenic compared to the WT (highlighted in white box). (C) Relative mRNA level of Glul-a is higher in the WT compared to the P23H (n = 3 fish per genotype; error bars are ± SD; * p < 0.05).

Acknowledgments
This image is the copyrighted work of the attributed author or publisher, and ZFIN has permission only to display this image to its users. Additional permissions should be obtained from the applicable author or publisher of the image. Full text @ Cells