- Title
-
Amyloid precursor protein-b facilitates cell adhesion during early development in zebrafish
- Authors
- Banote, R.K., Chebli, J., Şatır, T.M., Varshney, G.K., Camacho, R., Ledin, J., Burgess, S.M., Abramsson, A., Zetterberg, H.
- Source
- Full text @ Sci. Rep.
|
Characterization of the appb mutation. (A) Schematic representation of the coding (box) and non-coding regions (line) of the appb gene, indicating the mutation point in exon 2 (red arrow). (B) Nucleotide sequence surrounding the deletions (dashed line indicates missing nucleotides). (C) Sanger sequencing chromatogram of the 3´end of exon 2 in wild-type and appbmutants shows a premature stop (dot) in the translated protein sequence in mutants. (D) Western blot analysis of Appb expression in adult brain from wild-type (n = 4) and appb mutants (n = 4) using the in house-generated Appb-specific antibody (EER15) and α-tubulin as loading control. Quantification shown as percentage of wild-type. (E) Morphology of appbmutants and wild-type zebrafish embryos at one-cell stage to 3 dpf larvae (e1, e3, e5, e7, e9 indicates wild-type and e2, e4, e6, e8, e10 are appbmutants). Scale in e5 shows measurement of larvae. (F) Embryo size measurement at the 1-cell stage (wt, n = 10; appb26_2/26_2, n = 8), 24 hpf (wt, n = 20; appb26_2/26_2, n = 20), 48 hpf (wt, n = 10; appb26_2/26_2, n = 8), the size of the embryo was measured across the yolk. The total body length of 24 hpf (wt, n = 20; appb26_2/26_2, n = 20), 48 hpf (wt, n = 15; appb26_2/26_2, n = 19) and 3 dpf (wt, n = 15; appb26_2/26_2, n = 19) and 3 dpf (wt, n = 15; appb26_2/26_2, n = 19). Error bars are in SD and p–values calculated by t-test. Data points are given to the right of each bar with triangles (wt) or filled circles (appb mut). (G) Quantification of cell protrusion phenotype shown as percentage of all embryos. Wild-type (n = 418) and appb mutant (n = 465). Scale bar= 500 μm. *p < 0.05, **p < 0.01 and ***p < 0.001. |

ZFIN is incorporating published figure images and captions as part of an ongoing project. Figures from some publications have not yet been curated, or are not available for display because of copyright restrictions. |
|
Changes in cell shape morphology in appb mutants. (A) Wild-type and (B) mutant embryos stained with phalloidin at 4 hpf. (C–E) Quantification of cell number and morphology. (F) Schematic of embryo at blastula stage and junction points connecting to number of cells. (G,H) Quantification of cells per junction points at sphere and germ ring stage. (Sphere: n = 12 wt, 12 appbmut and germ ring: n = 11 wt, 10 appb mut). Student’s t-test was used to analyze data. *p < 0.05 and **p < 0.01. |
|
Proliferation of EVL in wild-type and appb mutants at 4 hpf. Representative confocal images of the EVL in wild-type (A) and appb mutant (B) embryos immunostained for the mitotic marker phospho-Histone H3 (pHH3; green) and actin binding phalloidin (red) at 4 hpf. All nuclei were labeled with DAPI (blue). Number of pHH3-positive EVL nuclei shown in percentage of all EVL cells (C). Student’s t-test was performed on wild-type (n = 8) and appbmutant (n = 8). Scale bar, 100 μm. PHENOTYPE:
|
|
Appb regulates blastoderm cell adhesiveness. Embryos of wild-type or appbmutant background were injected with red (R) or green (G) fluorescent dextran at the one-cell stage, dissociated and mixed 1:1 at sphere stage and co-cultured in fibronectin coated plates (A,B). Cluster formation started around 6 hours post dissociation (hpd) (C,D) and was allowed to proceed for 16 hpd before image analysis (E,F). Scale bar = 200 μm. Frequency distributions of scattering ‘S’ (G) and dipole moment ‘P’ (H) of red and green cells in clusters of wt/wt (black line) and wt/appb mut (grey line). Dashed lines mark interval for scattering. *p < 0.05. |
|
Increased sensitivity to ionomycin treatment in appb mutants. (A,B) Wild-type and appb mutant embryos treated with DMSO control. (C,D) 5 μM ionomycin treatment of wild-type and appb mutants embryos. (E) Quantification of ionomycin sensitivity. Scale bar, 1500 μm. PHENOTYPE:
|
|
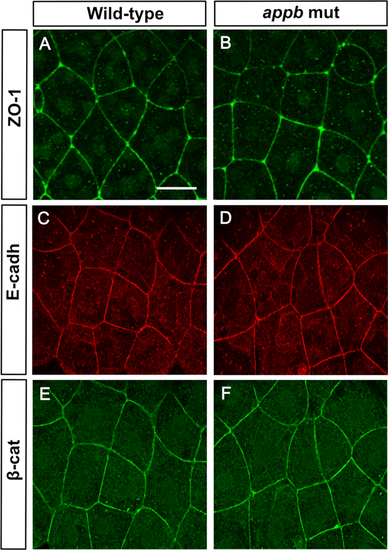
Normal expression of ZO-1, E-cadherin and β-catenin at 5.7hpf in appbmutants. Wild-type and mutant embryos at 5.7 hpf stained with ZO-1 (A,B), E-cadherin (C,D) and β-catenin (E,F). Wild-type (n = 11) and appb mutant (n = 12). Scale bar = 25 μm. EXPRESSION / LABELING:
|
|
Expression of app family in appb mutants. Whole mount in situ hybridization of appa (A), appb (B), aplp1 (C) and aplp2 (D) at 24 hpf. Upper panel: whole embryos; middle panel: head (dorsal view) and lower panel: trunk in each set of genes (anterior to left). Scale bar =500 μm (upper panel), 100 μm (middle panel) and 50 μm (lower panel). (E) Whole embryo qPCR analysis of appa, appb, aplp1 and aplp2 at 24 hpf. Values are reported as mean ±SEM. ****p < 0.001. (F) Western blot analysis and quantification of zebrafish App expression in appb mutants (n = 4) at 24 hpf using the Y188 antibody shown as ratio of wild-type (n = 4). Mean is reported as ± SD. Fl, full length; im, immature. *p < 0.05, **p < 0.01 and ****p < 0.001. ov, otic vesicle; Fb, forebrain; Mb, midbrain; Hb, hindbrain; llp, lateral line primordium; tg, trigeminal ganglia. |

ZFIN is incorporating published figure images and captions as part of an ongoing project. Figures from some publications have not yet been curated, or are not available for display because of copyright restrictions. PHENOTYPE:
|


