FIGURE SUMMARY
Title

Haploinsufficiency of mechanistic target of rapamycin ameliorates bag3 cardiomyopathy in adult zebrafish

Authors
Ding, Y., Dvornikov, A.V., Ma, X., Zhang, H., Wang, Y., Lowerison, M., Packard, R.R., Wang, L., Chen, J., Zhang, Y., Hsiai, T., Lin, X., Xu, X.
Source
Full text @ Dis. Model. Mech.

ZFIN is incorporating published figure images and captions as part of an ongoing project. Figures from some publications have not yet been curated, or are not available for display because of copyright restrictions.

The bag3e2/e2 mutant manifests a cardiac dysfunction phenotype. (A,B) Blood flow indices measured using a custom 30 MHz ultrasound probe. n=8-10, Student's t-test. (C) Examples of echocardiography images extracted from movies of beating hearts in WT controls and bag3e2/e2 mutants at systole (upper panel) and diastole (lower panel). (D) Quantification of cardiac function indices measured by echocardiography in the bag3e2/e2 mutant and WT control at 6 months. n=8, Student's t-test. (E-J) Cardiac pump function indices as measured by ex vivo heart pump function assay. n=12-13, Student's t-test. Data are mean±s.e.m.

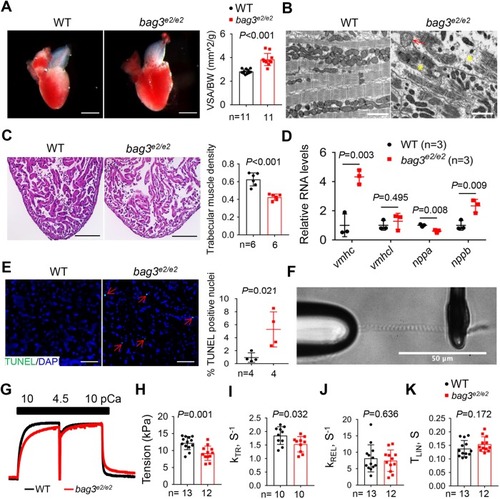
bag3e2/e2 mutants manifest hallmarks of cardiomyopathy resembling DCM in mammals. (A) Representative images of isolated hearts and quantification of the ventricular surface area (VSA) normalized to body weight (BW) in the bag3e2/e2 mutants and WT controls at 6 months. n=11, Student's t-test. (B) TEM images confirmed the myofibril degeneration phenotype (yellow asterisks) and identified abnormal mitochondrial swelling (red arrows) in the bag3e2/e2 mutant fish heart at 6 months. (C) Representative images of H&E staining in the apex area and quantification of trabecular muscle density in the bag3e2/e2 mutants and WT controls at 6 months. n=6, Student's t-test. (D) Quantitative RT-PCR analysis of cardiomyopathy molecular markers in bag3e2/e2 mutant hearts. n=3 biological replicates, Student's t-test. (E) Representative images of the TUNEL assay and quantification of the percentage of TUNEL-positive nuclei (red arrows) in the bag3e2/e2 mutant and WT control at 6 months. n=4, Student's t-test. (F) A representative image of a single myofibril isolated from the bag3e2/e2 mutant fish heart attached to glass microtools. (G) Example of a myofibril activation trace (pCa 10→4.5) with force-redevelopment during the release–restretch maneuver and relaxation when pCa was changed back from 4.5 to 10. Activation (pCa=4.5) and the fast release–restretch maneuver were used to measure kTR in myofibrils from WT and the bag3e2/e2 mutant fish heart at 6 months. (H) Quantification of maximal isometric tension in activated single myofibrils. (I-K) Rates of force redevelopment (KTR) (I), fast relaxation (KREL) (J) and the time of the linear phase of relaxation (TLIN) (K) in the bag3e2/e2 mutant and WT control at the single-myofibril level. H-K, n=10-13, Student's t-test. Data are mean±s.e.m. Scale bars: 1 mm in A; 2 µm in B; 100 µm in C; 20 µm in E; 50 µm in F.

Transcriptome analysis identifies mTOR as one of the top signaling pathways affected in the bag3e2/e2 mutant. (A) Numbers of differentially expressed (DE) genes between bag3e2/e2 mutant hearts and WT control with a cutoff of adjusted P<0.05. (B) Heat map presenting the expression of 5361 DE genes between the bag3e2/e2 mutant and WT control. Gene expression levels are shown in log10 [reads per kilobase per million reads (RPKM)]. (C) The top 10 DE gene enriched pathways with significant P-values suggested by IPA. The red column shows that the mTOR pathway was one of the top pathways altered and was subsequently experimentally tested. (D) Representative western blot images and quantification analysis of the expression levels of mTOR downstream proteins. LC3-II protein was examined in heart tissues from fish treated with 50 nM bafilomycin A1 for 4 h. n=4 biological replicates, Student's t-test. Data are mean±s.e.m.

EXPRESSION / LABELING:
Antibodies:
Fish:
Anatomical Term:
Stage: Adult
PHENOTYPE:
Fish:
Observed In:
Stage: Adult

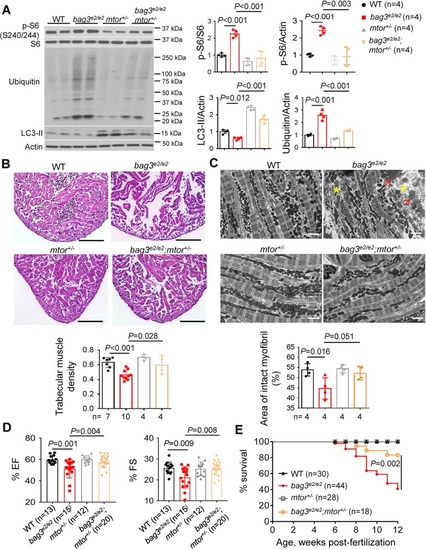
Genetic testing reveals the therapeutic effects of mtor+/− on bag3 cardiomyopathy. (A) Western blot and quantification analysis of ribosomal S6 protein (p-S6), LC3-II and ubiquitinated proteins in the bag3e2/e2;mtor+/− double mutants compared with their corresponding single mutants and the WT control at 6 months. LC3-II protein was examined in heart tissues dissected from fish treated with 50 nM bafilomycin A1 for 4 h. n=4 biological replicates, one-way ANOVA. (B) Representative H&E staining images from the apex area and quantification of the trabecular muscle density from the bag3e2/e2;mtor+/− double mutants and their corresponding single mutants and WT controls at 6 months. n=4-10, one-way ANOVA. (C) TEM images and quantification analysis of bag3e2/e2;mtor+/− mutants at 6 months compared with their siblings harboring either single mutants or the WT control. Yellow asterisks indicate regions of myofibril degeneration. Red arrows indicate mitochondria with abnormal swelling. (D) Percent EF and FS of bag3e2/e2;mtor+/− double mutant fish at 6 months compared with their corresponding single mutants and the WT control. n=12-20, one-way ANOVA. (E) Kaplan–Meier survival curves of the bag3e2/e2;mtor+/− double mutants compared with their corresponding single mutants and the WT control. n=18-44, log-rank test. Scale bars: 100 µm in B; 2 µm in C. Data are mean±s.e.m.

Acknowledgments
This image is the copyrighted work of the attributed author or publisher, and ZFIN has permission only to display this image to its users. Additional permissions should be obtained from the applicable author or publisher of the image. Full text @ Dis. Model. Mech.