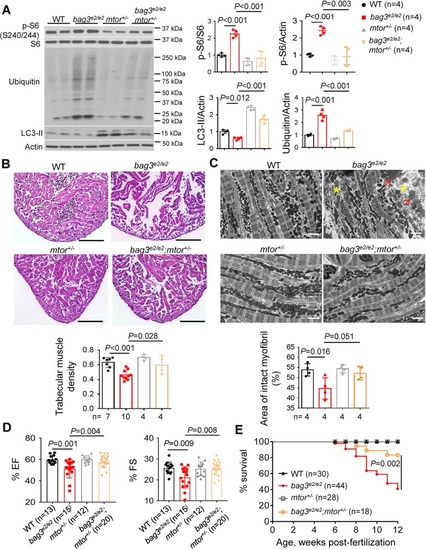
Genetic testing reveals the therapeutic effects of mtor+/− on bag3 cardiomyopathy. (A) Western blot and quantification analysis of ribosomal S6 protein (p-S6), LC3-II and ubiquitinated proteins in the bag3e2/e2;mtor+/− double mutants compared with their corresponding single mutants and the WT control at 6 months. LC3-II protein was examined in heart tissues dissected from fish treated with 50 nM bafilomycin A1 for 4 h. n=4 biological replicates, one-way ANOVA. (B) Representative H&E staining images from the apex area and quantification of the trabecular muscle density from the bag3e2/e2;mtor+/− double mutants and their corresponding single mutants and WT controls at 6 months. n=4-10, one-way ANOVA. (C) TEM images and quantification analysis of bag3e2/e2;mtor+/− mutants at 6 months compared with their siblings harboring either single mutants or the WT control. Yellow asterisks indicate regions of myofibril degeneration. Red arrows indicate mitochondria with abnormal swelling. (D) Percent EF and FS of bag3e2/e2;mtor+/− double mutant fish at 6 months compared with their corresponding single mutants and the WT control. n=12-20, one-way ANOVA. (E) Kaplan–Meier survival curves of the bag3e2/e2;mtor+/− double mutants compared with their corresponding single mutants and the WT control. n=18-44, log-rank test. Scale bars: 100 µm in B; 2 µm in C. Data are mean±s.e.m.
|
