IMAGE

Fig. 2.

ID
ZDB-IMAGE-191230-520
Source
Figures for Ding et al., 2019
Image
Figure Caption

Fig. 2.

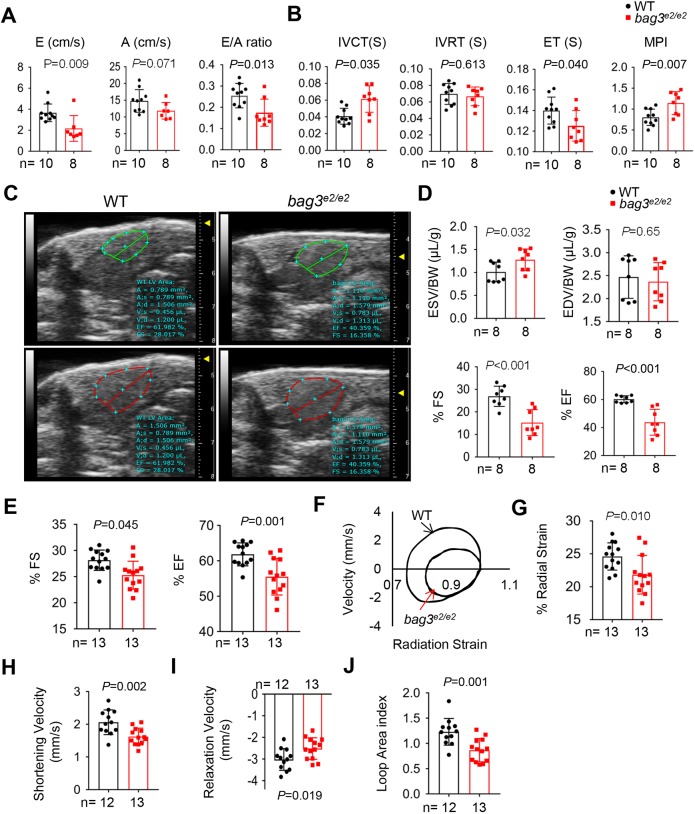
The bag3e2/e2 mutant manifests a cardiac dysfunction phenotype. (A,B) Blood flow indices measured using a custom 30 MHz ultrasound probe. n=8-10, Student's t-test. (C) Examples of echocardiography images extracted from movies of beating hearts in WT controls and bag3e2/e2 mutants at systole (upper panel) and diastole (lower panel). (D) Quantification of cardiac function indices measured by echocardiography in the bag3e2/e2 mutant and WT control at 6 months. n=8, Student's t-test. (E-J) Cardiac pump function indices as measured by ex vivo heart pump function assay. n=12-13, Student's t-test. Data are mean±s.e.m.

Figure Data
Acknowledgments
This image is the copyrighted work of the attributed author or publisher, and ZFIN has permission only to display this image to its users. Additional permissions should be obtained from the applicable author or publisher of the image. Full text @ Dis. Model. Mech.