- Title
-
Vascular defects of DYRK1A knockouts are ameliorated by modulating calcium signaling in zebrafish
- Authors
- Cho, H.J., Lee, J.G., Kim, J.H., Kim, S.Y., Huh, Y.H., Kim, H.J., Lee, K.S., Yu, K., Lee, J.S.
- Source
- Full text @ Dis. Model. Mech.
|
|
|
|
|
|
|
PHENOTYPE:
|
|
|
|
|
|
|
|
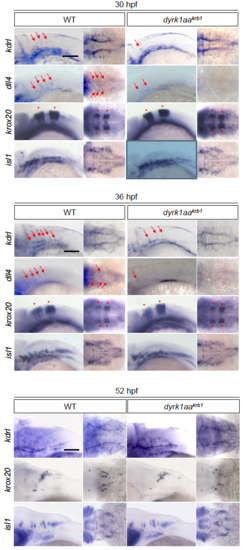
Expression of vascular markers is reduced in dyrk1aakrb1 mutant embryos, but the hindbrain development is not affected. The vascular markers of kdrl and dll4 were reduced at 30 and 36 hpf (red arrows), and kdrl expression was decreased in 52 hpf. The markers of krox20 (red asterisks) and isl1 were unchanged in dyrk1aakrb1 mutant embryos. Scale bars: 100 μm |
|
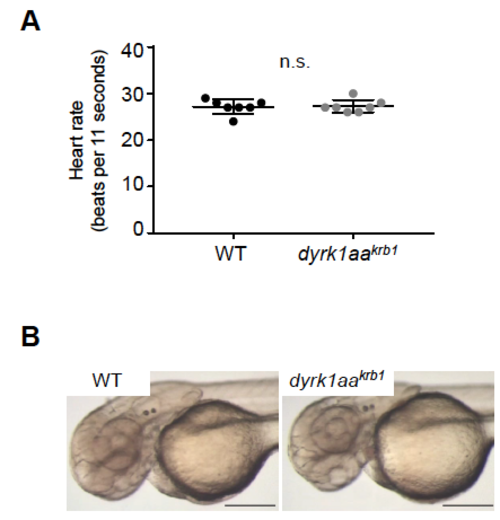
dyrk1aa mutation does not affect the heart rates of zebrafish embryos at 52 hpf. (A) Heart rates were measured in WT and dyrk1aakrb1 embryos under a light microscope during 11 seconds at RT. N=7 each genetic group. (B) The captured images to measure the heart rates of WT and dyrk1aakrb1 embryos (refer to the Movies 1 and 2 for actual movies). p-values by Mann-Whitney U test: n.s., not significant. Data are mean ±s.e.m. Scale bars: 250 μm PHENOTYPE:
|
|
dyrk1ab is expressed in the developing brain region. By WISH (whole mount in situ hybridization), dyrk1ab was expressed in the forebrain (black arrowheads, a-f; black brackets, g-l), the midbrain (gray arrowheads, a-f; gray brackets, g-l), the hindbrain (blue arrowheads, a-f; blue brackets, g-l) at 24, 48 and 72 hpf and the spinal cord (orange arrowheads, a and b) at 24 hpf. It was also detected in the heart (asterisks, d, f, j and l) and in the retina (red arrows, i-l) at 48 and 72 hpf. (m and n) Sectioned images of WISH embryos showed the expression of dyrk1ab in the tectum (green arrows) and the retina (red arrows) at 48 hpf and 72 hpf. Scale bars: 200 μm in (a-l) and 50 μm in (m and n) EXPRESSION / LABELING:
|
|
The vascular phenotype by EGTA treatment is not affected in WT embryos. No differences were observed in the mean percentages of cerebral hemorrhage in WT embryos (A) and the mean percentages of length and branching points of CtAs (C) by 1, 10 and 100 nM EGTA treatment. (B) The compiled images of CtAs by confocal microscopy show that the development of the CtAs with dyrk1aakrb1 embryos are rescued by 1 nM and 10 nM of EGTA treatment in the Tg(kdrl:EGFP) background (see Fig. 6D). WT embryos are not affected by EGTA treatment. p-values by one-way ANOVA: n.s., not significant. Data are mean±s.e.m. Scale bar: 50 μm. EXPRESSION / LABELING:
|

ZFIN is incorporating published figure images and captions as part of an ongoing project. Figures from some publications have not yet been curated, or are not available for display because of copyright restrictions. |


