
- Title
-
A conserved morphogenetic mechanism for epidermal ensheathment of nociceptive sensory neurites
- Authors
- Jiang, N., Rasmussen, J.P., Clanton, J.A., Rosenberg, M.F., Luedke, K.P., Cronan, M.R., Parker, E.D., Kim, H.J., Vaughan, J.C., Sagasti, A., Parrish, J.Z.
- Source
- Full text @ Elife

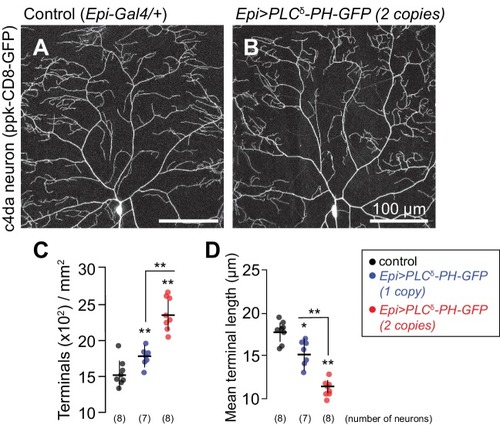
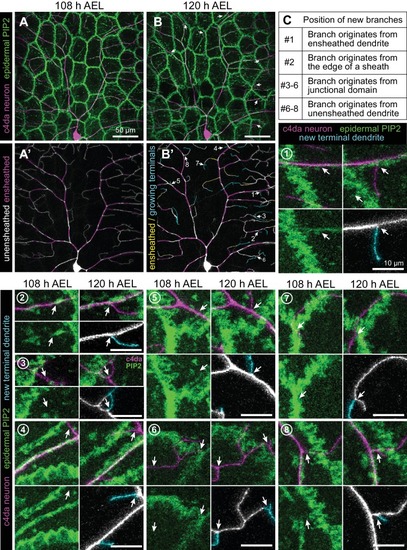
Epidermal PIP2 accumulation marks sites of dendrite ensheathment.( A) Schematic depicting epidermal neurite ensheathment in the Drosophila larval body wall. ( B, C) SBF-SEM analysis of epidermal dendrite ensheathment. ( B’ and B”) Traces of da neuron dendrites and epidermal sheaths in cross-section. ( C) Serial sections showing epidermal ensheathment (arrowheads mark sheaths) of da neuron dendrites (shaded green). The dendrite present in sections z1-z38 branches inside an epidermal sheath. See also Figure 1—video 1. ( D, E) Assay for markers of dendrite ensheathment. GFP-tagged markers were specifically expressed in the epidermis ( A58-Gal4, Cha-Gal80) in larvae expressing the c4da-specific marker ppk-CD4-tdTomato. Maximum intensity projections of membrane-targeted CD4-tdGFP ( D) and c4da dendrites ( E) are shown. Insets show magnified views of c4da dendrites (top) and c4da soma (bottom). ( F–K) Epidermal PLCδ-PH-GFP labels sites of dendrite ensheathment. Maximum intensity projections of epidermal PLCδ-PH-GFP ( F, H, J) and overlay showing PLCδ-PH-GFP signal in green and ppk-CD4-tdTomato in magenta to label c4da dendrites ( G, I, K). Hatched lines mark sheaths. ( F–I) XY projections of live confocal images. ( J, K) Representative image showing epithelial PIP2 distribution at sites of c4da dendrite contact visualized using expansion microscopy. Image shows a side view of a single epithelial cell and ensheathed c4da dendrites oriented along the apical-basal axis (apical, top). Note the discontinuities in the epithelial sheath at the dendrite branch point and at epithelial intracellular junctions (arrowheads). Sheaths from six independent neurons analyzed with expansion microscopy showed similar structures. Scale bars have been divided by the measured expansion factor of ~4 × and therefore refers to pre-expansion dimensions. ( L–U) Epidermal sheath markers. Maximum intensity projections show the distribution of the indicated GFP reporters in the epidermis of 120 h after egg laying (AEL) larvae and composites show portions of c4da dendrite arbors (shaded purple) wrapped by sheaths labeled by the GFP reporters. |
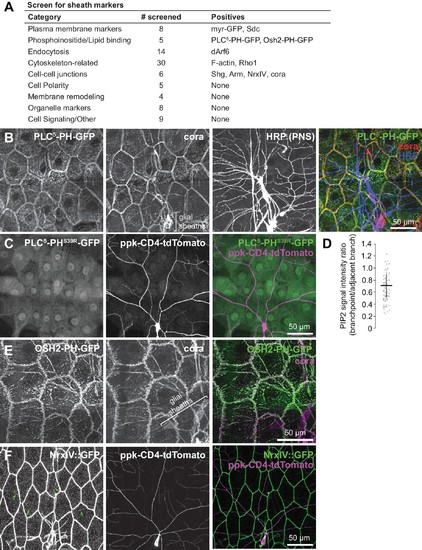
Screen for epithelial markers that accumulate at sites of c4da dendrite contact.( A) Summary of screen results. For a full list of markers screened, see Supplementary file 1. ( B) Co-localization of PLCδ-PH-GFP and coracle. Maximum intensity projections of GFP, cora, and HRP (to label PNS neurons) immunostaining of larva expressing PLCδ-PH-GFP in the epidermis. Bracket marks glial sheaths labeled by cora. ( C) PH domain mutation abrogates PLCδ-PH-GFP sheath labeling. Image shows epidermal distribution of a PLCδ-PH-GFP mutant (S39R) that is unable to bind PIP2 in a larva expressing the c4da-specific marker ppk-CD4-tdTomato. ( D) PIP2 is locally depleted from branch points. Plot depicts ratios of PLCδ-PH-GFP signal intensity at branch points and on dendrite shafts adjacent to branchpoints. n = 20 branch points from five neurons (100 total). ( E) Co-localization of PLCδ-PH-GFP and coracle. Maximum intensity projections of anti-GFP and anti-coracle immunostaining of larva expressing OSH2-GFP in the epidermis. ( F) Sheath localization of the septate junction protein Neurexin-IV. Maximum intensity projections of Neurexin-IV-GFP and ppkCD4-tdTomato are shown. Arrows mark sheaths labeled by Neurexin-IV-GFP. |

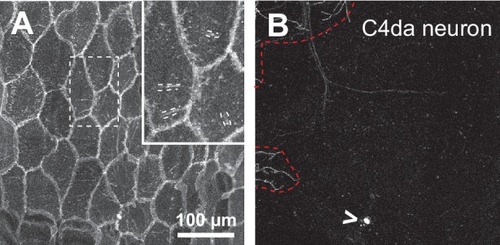
c4da neurons are enclosed by epidermal sheaths.( A–C) Double labeling of sensory neurons (HRP) and epidermal sheaths (PLCδ-PH-GFP fluorescence) stained under non-permeabilizing conditions. Maximum projection images show double labeling ( A), epidermal PLCδ-PH-GFP signal intensity ( B), and HRP surface staining intensity ( C). Dashed lines mark sheath segments for which intensity profiles are shown in ( D, E). Note the apparent reciprocal relationship between surface-exposed HRP and PLCδ-PH-GFP intensities. ( F, G) Scatterplots show the relationship between surface-exposed HRP and PLCδ-PH-GFP signal intensities on sheaths from eight individual neurons at 84 h after egg laying (AEL), shortly after sheath formation is initiated ( F) and at 120 h AEL, when c4da neurons are extensively ensheathed ( G). Note the inverse linear regression. |
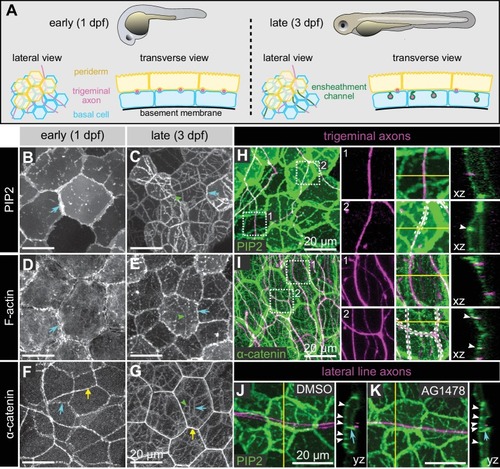
Molecular markers of epidermal sheaths in larval zebrafish.( A) Schematic of the bilayered larval zebrafish epidermis at the indicated stages based on the ultrastructural analysis (O'Brien et al., 2012). ( B–G) Maximum intensity projections of confocal z-stacks showing lateral views through the epidermis at 24 hpf ( B,D,F) or 72 hpf ( C, E, G). Fluorescent reporters for PIP2 ( B, C), F-actin ( D, E), and α-catenin ( F, G) are shown. Note the appearance of linear domains of each reporter through the apical basal cell membrane (green arrowheads) at the later time-point. Cyan arrows indicate basal lateral cell borders. Yellow arrows indicate periderm lateral cell borders. ( H, I) Dual-labeling of epidermal sheaths and trigeminal sensory neurons. tdTomato-labeled trigeminal sensory neurons (magenta) together with the PIP2 reporter GFP-PH-PLC in basal cells at 46 hpf ( H) or α-catenin-Citrine in both periderm and basal cells ( I) at 73 hpf. Inset 1, examples of axons not associated with PIP2 ( H) or α-catenin ( I) enrichment. Inset 2, examples of axon-associated PIP2 ( H) or α-catenin ( I) enrichment. White dashed lines and arrowheads indicate examples of ensheathment channels containing labeled axons. Yellow lines indicate planes of orthogonal sections. ( J, K) tdTomato-labeled posterior lateral line axons (magenta) labeled by transient injection of a neurod:mTangerine plasmid are shown together with GFP-PH-PLC signal in basal cells (green) at 78 hpf in either DMSO- or AG1478-treated embryos. AG1478 treatment prevents the repositioning of the posterior lateral line nerve below the epidermis (Raphael et al., 2010), resulting in the indentation of basal cell membranes, but did not trigger the accumulation of the PIP2 reporter GFP-PH-PLC. Arrowheads indicate ensheathment channels along the apical surface of basal cells. Cyan arrows indicate basal cell lateral borders. Yellow lines indicate planes of orthogonal sections. Note that because of the markers used, somatosensory and lateral line axons are sparsely labeled. Details of zebrafish experimental genotypes are provided in Supplementary file 2. |

Epithelial sheaths form adjacent to somatosensensory neurons in a modality-specific manner.( A–C) Dual-labelling of epithelial sheaths and all somatosensory neurons. Maximum projections of confocal stacks show ( A) mRFP-labeled sensory neurons (magenta) together with epidermal PLCδ-PH-GFP signal (green) or ( B) epidermal PLCδ-PH-GFP signal on its own. ( C) PLCδ-PH-GFP-positive sheaths are pseudocolored with dendrite-associated sheaths shaded in magenta and sheaths without apposed dendrites shaded in green. ( D, E) Dual-labeling of epithelial sheaths and c3da/c4da sensory neurons. ( D) tdTomato-labeled c3da and c4da neurons (magenta) are shown together with epidermal PLCδ-PH-GFP signal (green). ( E) Image showing epidermal PLCδ-PH-GFP signal with c3da-containing sheaths shaded green and c4da-containing sheaths shaded magenta. ( F) Histogram depicting mean and standard deviation values for the portion of the dendrite arbor of different classes of da neurons ensheathed by the epidermis using PLCδ-PH-GFP or cora immunostaining as a marker for ensheathment. ( G–K) The extent of ensheathment was inversely correlated with trigeminal (TG) axon complexity in zebrafish. Examples of single TG neurons labeled by transient injection of Tg(isl1[ss]:LEXA-VP16,LEXAop:tdTomato) with low ( G, H) or high ( I, J) branch density. Epidermal sheaths are shaded in magenta in ( H, J). ( K) Scatterplot of axon branches versus percentage of axon length ensheathed from tracings of 12 individual TG neurons. Note the inverse linear regression (blue line) |
( |
( |
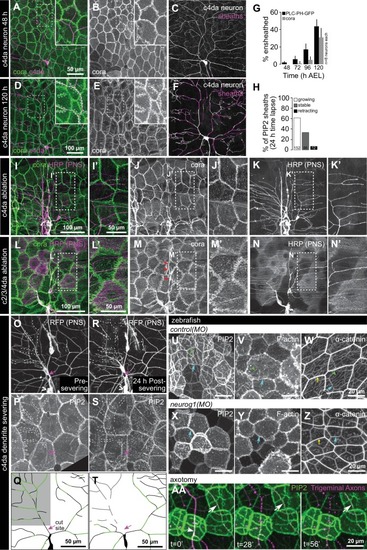
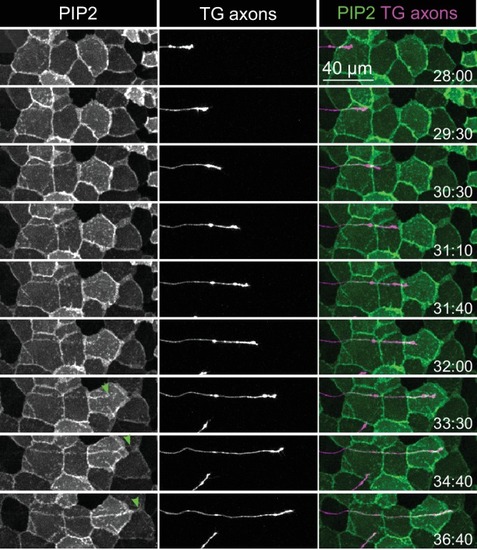
Somatosensory neurons are necessary for formation and maintenance of epidermal sheaths.( A–G) Timecourse of sheath formation. Maximum intensity projections show dual labeling of sheaths by epidermal PLCδ-PH-GFP and the c4da-specific marker ppk-CD4-tdTomato ( A, D) or PLCδ-PH-GFP signal alone ( B, E) at 48 and 120 h AEL. ( C, F) Composites show portions of c4da dendrite arbors (shaded purple) wrapped by sheaths labeled by PLCδ-PH-GFP. ( G) Plot shows mean and standard deviation values for the proportion of c4da dendrite arbors wrapped by PLCδ-PH-GFP or cora-positive sheaths at the indicated time points. See also Figure 4—figure supplement 2 for images of cora labeling of sheaths at 72 and 120 h AEL. ( H) Once formed, sheaths persist. Plot shows sheath dynamics; the proportion of sheaths from eight neurons that grew, retracted, or were stable over a 24 h time-lapse is shown. See also Figure 4—figure supplement 1 for time-lapse images. ( I–K) Epidermal sheath formation following genetic ablation of c4da neurons. Maximum intensity projections show dual labeling of anti-cora staining to label sheaths and anti-HRP staining to label PNS neurons ( I) and the individual markers alone ( J, K) at 120 h AEL for a larva expressing the pro-apoptotic gene reaper ( rpr) specifically in c4da neurons under control of ppk-Gal4. ( L–N) Epidermal sheath formation following laser ablation of larval c2da, c3da, and c4da neurons. Images show dual labeling of epidermal sheaths with anti-cora staining and sensory neurons with anti-HRP staining ( L) and the individual markers alone ( M, N) at 120 h AEL in a hemisegment in which c2da, c3da, and c4da were ablated with a focused laser beam at 72 h AEL. Red arrowheads in ( M) mark cora-positive structures (also visible in Figure 1R and Figure 4—figure supplement 2) located in the dorsal-medial portion of the hemisegment, corresponding to the position of the dorsal pharyngeal sense organ. These structures are not co-labeled by other epidermal sheath markers and cora immunoreactivity persists following epidermal cora(RNAi) (Figure 5—figure supplement 2), suggesting that these structures are distinct from the epidermal sheaths that wrap sensory neurites. ( O–T) Somatosensory dendrites are required for sheath maintenance. Maximum projections of confocal stacks show time-lapse images of da neurons labeled with membrane-targeted mRFP ( O) and epidermal sheaths ( P) immediately prior to c4da dendrite severing at 108 h AEL and 12 h post-severing at 120 h AEL ( R, S). White dashed lines outline the anterior-dorsal portions of the c4da arbor that are ensheathed prior to severing and the location those sheaths would occupy if they persisted post-severing. ( Q, T) Traces depict unensheathed c4da dendrites in black and ensheathed c4da dendrites in green, the arrow marks the site of dendrite severing, and the gray box marks the quadrant in which c4da dendrites and associated epidermal sheaths are lost post-severing. ( U–Z) Epidermal sheath formation in zebrafish injected with a morpholino targeting neurog1 to prevent somatosensory neuron development. Maximum intensity projections of confocal z-stacks showing lateral views through the zebrafish epidermis at 72 hpf. Note the lack of ensheathment channels (green arrowheads) in neurog1(MO)-injected embryos. Yellow and cyan arrows indicate the lateral cell membranes of periderm and basal cells, respectively. ( AA) Somatosensory axons are required for sheath maintenance in zebrafish. Arrowhead and arrow indicate sheaths associated with a severed and intact axon, respectively. |

Representative ddaC c4da neuron imaged at 84 h ( |

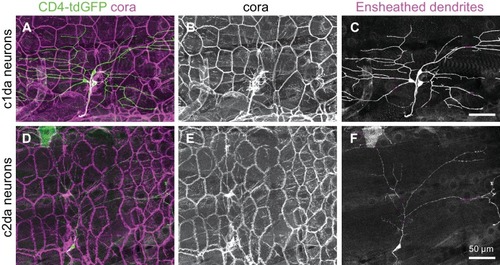
Dual-labeling of cora and c4da neurons at 72 h AEL ( |
Maximum projections of confocal stacks show ( |

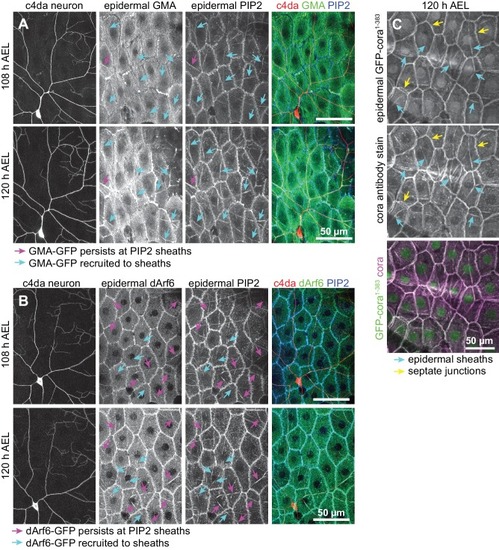
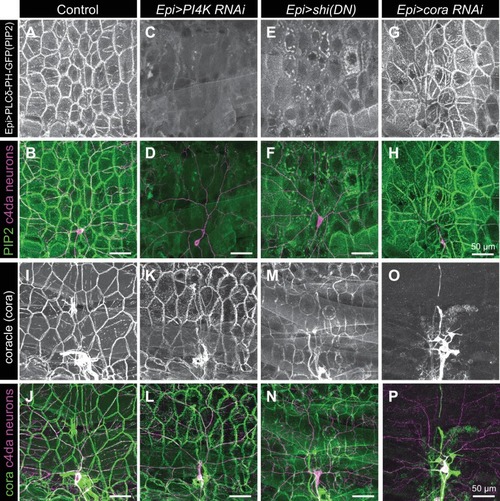
( A–D) Time of arrival of PIP2 and other sheath markers. Images show dual labeling of sheaths by PLCδ-PH-Cerulean and dArf6-GFP ( A) or GMA-GFP to label F-actin ( C) in larvae additionally expressing the c4da-specific marker ppk-CD4-tdTomato. ( B, D) Plots show mean and standard deviation values for the proportion of c4da dendrite arbors ensheathed by structures labeled by the indicated markers at the indicated times. All sheath structures labeled by dArf6-GFP and GMA-GFP were labeled by PLCδ-PH-Cerulean. ( E) Time-lapse images show dual labeling of sheaths by PLCδ-PH-Cerulean and GFP-cora1-383 in larvae additionally expressing the c4da-specific marker ppk-CD4-tdTomato. Cyan arrows mark single-positive (Cerulean-positive) sheaths that convert to double-positive (Cerulean-positive and GFP-positive), magenta arrows mark double-positive sheaths that persist. See also Figure 5—figure supplement 1 for time-lapse images depicting dArf6-GFP and GMA-GFP recruitment to PLCδ-PH-Cerulean sheaths. ( F) Quantification of marker recruitment. Bars depict the proportion of PLCδ-PH-Cerulean-positive GFP-negative sheaths at 104 h AEL that are labeled by the indicated markers at 120 h AEL. More than 100 sheaths (from six independent time-lapse series) were scored for each marker combination. ( G) Timing of accumulation of ensheathment channel markers in the zebrafish epidermis. ( H) Epistatic relationship between markers. The indicated RNAi transgenes were expressed in the epidermis and effects on ensheathment were assessed (see Figure 5—figure supplement 2 for accompanying images). Plots show mean and standard deviation values for the proportion of c4da dendrite arbors wrapped by PLCδ-PH-GFP or cora-positive sheaths. n = 8 neurons each; ***p<0.001 relative to control; one way ANOVA with post-hoc Dunnett’s test. ( I) Model depicting the timing of arrival of sheath components. |
Time-lapse images show dual labeling of epidermal sheaths by PLCδ-PH-Cerulean and GMA-GFP ( |
Live-imaging of PIP2 in basal cells [ |
( |
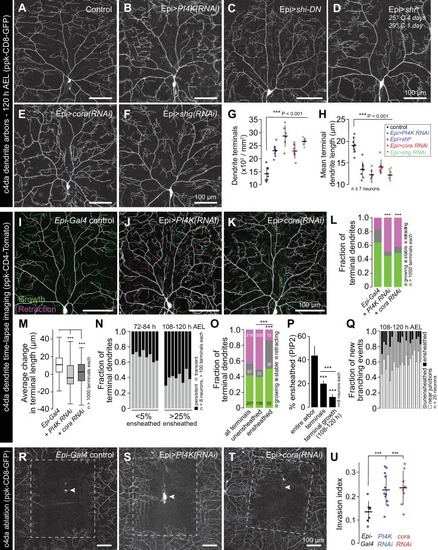
Representative images of 120 h AEL c4da neurons from ( A) control larvae and larvae expressing ( B) PI4K(RNAi), ( C) dominant-negative shibire (shiDN), ( D) temperature-sensitive shibire ( shits), ( E) epidermal cora(RNAi), and ( F) epidermal shg(RNAi) larvae are shown. Larvae were reared at 25° C, with the exception of larvae in ( D) which were reared at 25° C for 4 days and then shifted to the non-permissive temperature 29° C for 1 day prior to imaging. ( G–H) Morphometric analysis of dendrites from c4da neurons of the indicated genotypes. Plots show mean and standard deviation for ( G) the number of terminal branches and ( H) terminal branch length. Data points, measurements from an individual neuron; ***p<0.001 relative to control; one way ANOVA with post-hoc Dunnett’s test. ( I–L) Time-lapse analysis of epidermal sheath control of terminal dendrite dynamics. C4da neurons were imaged over an 18 h time-lapse (96–114 h AEL) and growth (green) and retraction (magenta) were pseudocolored in a composite of the two time-points. Representative composite images are shown for c4da neurons from ( I) Gal4-only control, ( J) epidermal PI4K(RNAi), and ( K) epidermal cora(RNAi) larvae. ( L–P) Quantification of terminal dendrite dynamics. ( L) The fraction of terminal dendrites that were growing, stable, or retracting over the time-lapse is shown. ***p<0.001 compared to controls, Chi-square analysis. ( M) Epidermal ensheathment regulates the extent of terminal dendrite dynamics. Box plots depict mean values and 1st/3rd quartile, whiskers mark minimum/maximum values. ***p<0.001 compared to Epi-Gal4 control; one way ANOVA with post-hoc Dunnett’s test. ( N) Epidermal ensheathment regulates dendrite turnover. C4da neurons were imaged over a 12 h time-lapse (72–84 or 108–120 h AEL) and all terminal dendrites were scored as persistent (present at both time points) or transient. Each bar represents measurements from a single neuron. Terminal dendrites at the later time-point, when c4da neurons are extensively ensheathed, were significantly more likely to persist. ( O) Quantification of terminal dynamics in ensheathed and unensheathed terminal dendrites from 108 to 120 h AEL. ***p<0.001, Chi-square analysis with post-hoc Bonferroni adjustment for multiple comparisons. Pairwise comparisons are indicated. ( P) Dynamic portions of dendrite arbors are less extensively ensheathed. Mean and standard deviation values for the proportion of c4da dendrite arbors, terminal dendrites, and new terminal dendrite growth (12 h time-lapse) wrapped by PLCδ-PH-GFP sheaths at 120 h AEL. ***p<0.001, Chi-square analysis with post-hoc Bonferroni adjustment for multiple comparisons. Pairwise comparisons are indicated. ( Q) Distribution of branching events during 12 h time-lapse imaging. Each bar represents a single neuron. ( R–U) Epidermal ensheathment regulates dendrite structural plasticity. Class IV neurons in newly eclosed 2nd instar control ( R), epidermis PI4k(RNAi) ( S), and epidermis cora(RNAi) ( T) larvae were ablated with a focused laser beam and imaged 48 h post-ablation. Images depict dendrite growth of spared neurons into unoccupied territory following laser ablation and hatched boxes demarcate the territory occupied by the ablated neuron. ( U) Scatter plot depicting mean and standard deviation for dendrite invasion of the indicated mutants. The number of samples analyzed for each treatment is indicated. ***p<0.001 relative to control; one way ANOVA with post-hoc Dunnett’s test. |
Representative images of 120 h AEL c4da neurons from ( |
C4da neurons were imaged over a 12 h time-lapse in larvae additionally expressing the epidermal sheath marker PLCδ-PH-GFP. Maximum projections show a representative neuron at 108 h ( |

Larvae were transferred at 72 h AEL to 35 mm dishes containing unmodified cornmeal-molasses agar (mock) or cornmeal-molasses agar supplemented with 20 µM PBP10 and assayed for behavior responses ( |