- Title
-
T-lymphoblastic lymphoma cells express high levels of BCL2, S1P1, and ICAM1, leading to a blockade of tumor cell intravasation
- Authors
- Feng, H., Stachura, D.L., White, R.M., Gutierrez, A., Zhang, L., Sanda, T., Jette, C.A., Testa, J.R., Neuberg, D.S., Langenau, D.M., Kutok, J.L., Zon, L.I., Traver, D., Fleming, M.D., Kanki, J.P., and Look, A.T.
- Source
- Full text @ Cancer Cell
|
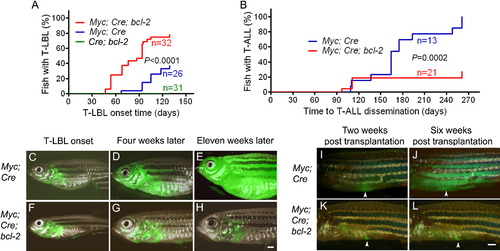
Bcl-2 Promotes Onset but Inhibits the Progression of Myc-Induced T-LBL in Zebrafish (A) Rate of tumor onset in three transgenic zebrafish lines: hsp70-Cre;rag2-EGFP-bcl-2 (Cre;bcl-2) double-transgenic fish (n = 31; green line), rag2-LDL-EGFP-Myc;hsp70-Cre (Myc;Cre) double-transgenic fish (n = 26; blue line), and rag2-LDL-EGFP-Myc;hsp70-Cre;rag2-EGFP-bcl-2 (Myc;Cre;bcl-2) triple-transgenic fish (n = 32; red line). (B) Rate of T-LBL progression to T-ALL in Myc;Cre (n = 13; blue line) versus Myc;Cre;bcl-2 (n = 21; red line) transgenic fish. (C–H) Localized GFP-labeled tumors first arose as T-LBL in Myc;Cre (C; 112-day) and Myc;Cre;bcl-2 (F; 119-day) transgenic fish; widespread dissemination leading to leukemia was seen within 11 weeks after T-LBL onset in Myc;Cre fish (D and ,E), but not in Myc;Cre;bcl-2 triple transgenics (G and H). (I–L) GFP-positive T-LBL tumor cells (n = 5 per group) transplanted into the peritoneum of irradiated wild-type hosts. Tumor cells from the Myc;Cre double-transgenic fish disseminated rapidly (I–J), while those from the Myc;Cre;bcl-2 triple-transgenics remained localized (K and L). Scale bar for (C)–(H) and (I)–(L), 1 mm. See also Figure S1. |
|
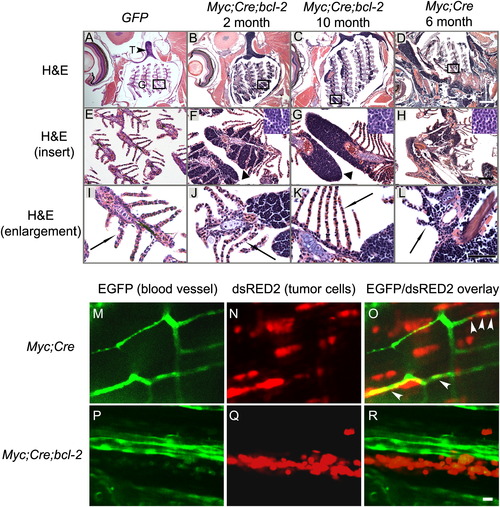
Zebrafish T-Lymphoblasts Overexpressing Bcl-2 Spread Locally but Fail to Intravasate into Vasculature (A, E, and I) T cells in a control fish are restricted to the thymus above the gill arches and underneath the operculum (n = 3). (B, C, F, G, J, and K) GFP and dsRED2-positive tumor cells (arrowheads; F,G) in the Myc;Cre;bcl-2 fish invade tissues outside the thymus and infiltrate local structures, including the primary lamellae (filaments) and cartilaginous gill rays by 2 months (B, F, and J; n = 3) but fail to invade vasculature by 10 months (C, G, and K; n = 3). (D, H, and L) By contrast, GFP- and dsRED2-expressing cells of the Myc;Cre transgenic fish (D, H, and L; n = 3) enter secondary lamellae that contain the capillary network (compare J and K with L, arrows) and disseminate widely throughout the host, infiltrating distant muscle and fat tissues by 6 months. (M, N, and O) dsRED2-expressing lymphoma cells (N) from the Myc;Cre fish intravasate into EGFP-labeled vasculature (M) of the transplant host (fli1-EGFP;Casper) by 6 day posttransplantation (see arrowheads in O). (P, Q, and R) In contrast, dsRED2-expressing lymphoma cells (Q) from the Myc;Cre;bcl-2 fish fail to intravasate vasculature (P) of the transplant hosts by 6 day posttransplantation (compare R with O). Note aggregates of the Myc;Cre;bcl-2 lymphoma cells in Q and R. Black arrowhead in (A) points to thymus (T) and the gill region is indicated (G). Inserts in (F)–(H) show enlargements of tumor cells. Scale bar for (A)–(D), 200 μm; for (E)–(H) 50 μm; for (I)–(L) and (M)–(R), 10 μm. See also Figure S2. PHENOTYPE:
|
|
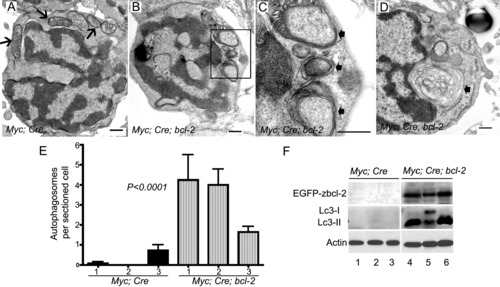
Zebrafish Lymphoblasts Overexpressing Myc and Bcl-2 Undergo Autophagy (A) Electron microscopic analysis rarely identified autophagosomes in tumor cells from Myc;Cre transgenic fish. Mitochondria are indicated by arrows. (B–D) Thymic lymphoblasts from Myc;Cre;bcl-2 triple-transgenics show prominent autophagosomes/autolysophagosomes. (C) is a magnified view of (B) (box). Arrows indicate double-membrane autophagosomes containing cytoplasm and cytoplasmic organelles. An autolysophagosome is shown in (D) (arrow). (E) Quantification of autophagosomes and autolysophagosomes in Myc;Cre (solid bars) and Myc;Cre;bcl-2 (hatched bars) tumor cells were harvested from three individual fish. From 9 to 15 different cells from each fish were sectioned and analyzed. Mean ± SD results from three individual fish are shown. (F) Western blot analyses of the protein levels of EGFP-zbcl-2, Lc3-I, and Lc3-II in three individual Myc;Cre and Myc;Cre;bcl-2 transgenic fish. Actin was used as a loading control in each lane. Scale bars for (A)–(D), 500 nm. See also Figure S3. |
|
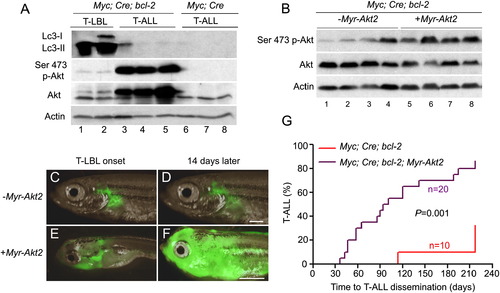
Akt Activation Promotes the Progression of T-LBL to T-ALL in Myc;Cre;bcl-2 Transgenic Fish (A) Western blot analysis of Lc3-I, Lc3-II, Ser473p-Akt, and Akt protein expression in zebrafish Myc;Cre;bcl-2 lymphoma (two tumor samples) and leukemia (three tumor samples) cells and in zebrafish Myc;Cre leukemia cells (three tumor samples). (B) Western blot analysis of Ser473p-Akt and Akt expression in Myc;Cre;bcl-2 (n = 4) and Myc;Cre;bcl-2;Myr-Akt2 (n = 4) zebrafish lymphomas. (C–F) Upon constitutive activation of Myr-Akt2, Myc;Cre;bcl-2 transgenic fish rapidly progress from T-LBL (E; T-LBL onset at 20 days) to T-ALL (F; at 34 days), compared with the Myc;Cre;bcl-2 transgenic fish lacking Myr-Akt2 expression (C and D). (G) Rate of T-LBL progression to T-ALL in Myc;Cre;bcl-2 transgenic fish (n = 10; red) and Myc;Cre;bcl-2;Akt2 transgenic fish (n = 20; purple). Actin protein levels in (A) and (B) served as loading controls. Scale bars for (C)–(F), 1 mm. See also Figure S4. |
|
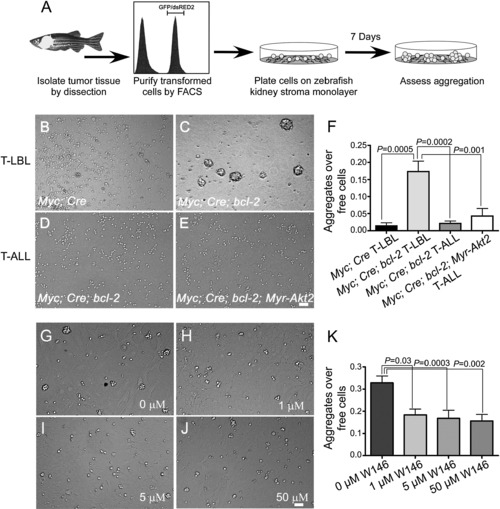
Bcl-2-Overexpressing T-LBL Cells Display Increased Aggregation that Can Be Overcome by Akt Activation or S1P1 Inhibition In Vitro (A) Schematic of the experimental strategy. (B–E) Brightfield images of lymphoma or leukemic tumor cells in culture for 7 days on ZKS stroma: (B) Myc;Cre T-LBL, (C) Myc;Cre;bcl-2 T-LBL, (D) Myc;Cre;bcl-2 T-ALL, or (E) Myc;Cre;bcl-2;Myr-Akt2 T-ALL cells. (F) Quantification of aggregates over free cells for tumor cell culture on ZKS cells under normal conditions for 7 days: Myc;Cre T-LBL (n = 10), Myc;Cre;bcl-2 T-LBL (n = 11), Myc;Cre;bcl-2 T-ALL (n = 13), or Myc;Cre;bcl-2;Myr-Akt2 T-ALL (n = 11) transgenic fish. (G–J) The formation of homotypic cell aggregation of Myc;Cre;bcl-2 T-LBL cells is inhibited after treatment with a specific S1P1 antagonist W146 (1, 5, and 50 μM) in ZKS stroma supported cell culture. (K) Ratio of cell aggregates to free cells in Myc;Cre;bcl-2 T-LBL cells 7 days after plating on ZKS stroma with vehicle only, or increasing amounts of W146 (n = 4 per group) ranging from 1 to 50 μM treatment. Bars in (F) and (K) represent means determined from independent animals, and error bars represent standard deviation of the mean. Scale bar for panels B-E and G-J = 40 μm. See also Figure S7. |
|
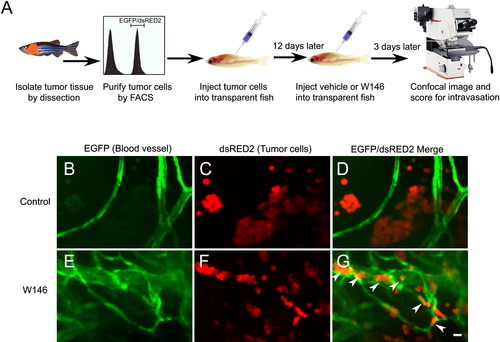
The Selective S1P1 Antagonist W146 Promotes Intravasation of Bcl-2-Overexpressing T-LBL Cells In Vivo (A) Schematic drawing of the experimental strategy. (B–G) Confocal images of EGFP-labeled blood vessels (B and E), dsRED2-labeled lymphoma cells (C and F), and the merged images of a vehicle-treated (D; n = 29) and a W146-treated transplanted animal (G; n = 18) demonstrate that W146 treatment promotes intravasation of bcl-2-overexpressing lymphoma cells (arrowheads) in vivo (cf. G to D). Note that W146 treatment also inhibited the in vivo formation of lymphoma cell aggregates (cf. F to C). Scale bar for (B)–(G), 10 μM. |
|
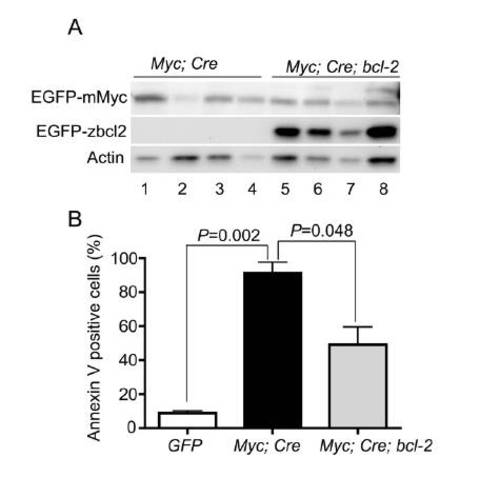
Similar Myc Levels and bcl-2 Suppression of Myc-induced Apoptosis in Premalignant Thymocytes of Myc;Cre and Myc;Cre;bcl-2 Transgenic Fish. (A) Western blot analyses reveal no significant differences in EGFP-mMyc protein levels in premaligant T-cells of Myc;Cre (n=4) versus Myc;Cre;bcl-2 (n=4) transgenic fish (P=0.67), despite variations of EGFP-mMyc levels among the individual fish and the striking levels of EGFP-zbcl-2 protein. Actin levels serve as a loading control. (B) FACS analysis of Annexin V-positive cells was performed on GFP-expressing control thymocytes of rag2-GFP (GFP) transgenic fish or premaligant thymocytes fromMyc;Cre and Myc;Cre;bcl-2 transgenic fish, respectively. Percentages of AnnexinV-positive cells for GFP vs. Myc;Cre; mean± SD: 8.72 ± 2.72 vs. 91.2 ± 15.77; Myc;Cre vs. Myc;Cre;bcl-2; mean± SD: 91.2 ± 15.77 vs. 49.13 ± 23.27; n=3 fish per group. |
|
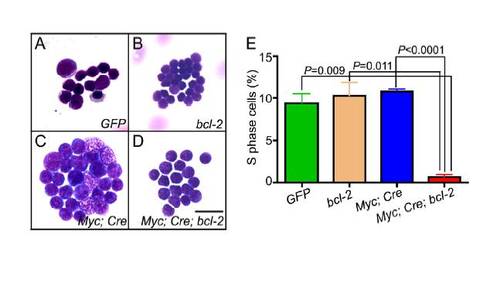
Bcl-2 Overexpression Inhibits Cell Proliferation in Myc-induced T-LBL in Zebrafish. (A-D) GFP-expressing thymocytes were FACS-sorted and stained with May-Grünwald-Giemsa to analyze the morphology of cells from (A) rag2-GFP (GFP), (B) rag2-EGFP-bcl-2 (bcl-2), (C) rag2-LDL-EGFP-mMyc;hsp70-Cre (Myc;Cre) and (D) rag2-LDL-EGFP-mMyc;hsp70-Cre;rag2-EGFP-bcl-2 (Myc;Cre;bcl-2) transgenic fish. (E) DNA flow cytometry demonstrates a decreased percentage of Myc;Cre;bcl-2 tumor cells in S phase, compared to control GFP, bcl-2, and Myc;Cre tumor cells (mean ± SD for GFP, bcl-2, Myc;Cre, Myc;Cre;bcl-2: 9.31 ± 2.39; 10.27 ± 3.29; 10.76 ± 0.54; 0.65 ± 0.61, respectively; n=4 fish per group). Scale bar for panels A-D = 10 μm. |
|
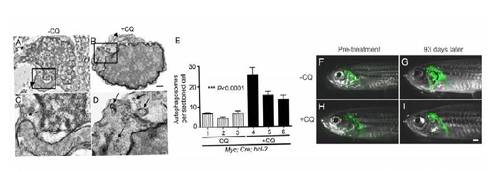
Autophagy Inhibition of Myc;Cre;bcl-2 T-LBL Cells Fails to Promote Dissemination of the Disease. (A-D) Electron microscopy demonstrate increased autophagosome formation in tumor cells from chloroquine (CQ)-treated Myc;Cre;bcl-2 transgenic fish (B,D), compared to tumor cells from control-treated animals (A,C). Mitochondria are indicated by arrowheads and double-membrane autophagosomes containing cytoplasm and cytoplasmic organelles by arrows. Panels C and D are an expanded view of the boxes in A and B. (E) Quantification of autophagosomes and autolysophagosomes in control-treated (hatched bars) and chloroquine-treated Myc;Cre;bcl-2 (solid bars) tumor cells harvested from three individual fish. Between 15-20 individual cells from each fish were sectioned and analyzed; the data are reported as means ± SD. Combined results for control-treated fish differ significantly from CQ-treated Myc;Cre;bcl-2 fish (P<0.0001). (F-I) Despite CQ treatment over 93 days, significant differences in the progression or regression of T-LBL in Myc;Cre;bcl-2 fish were not detected relative to control-treated fish. Scale bars for panels A-B = 500 nm; for panels C-D = 100nm; and for panels F-I = 1mm. |
|
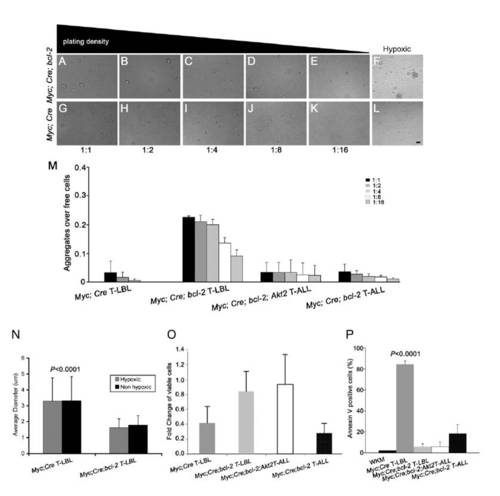
T-LBL Cells Overexpressing bcl-2 and Myc are smaller, resistant to apoptosis, and from Aggregates at Low Cell Density and under Hypoxic Conditions, without active proliferation. (A-L) Brightfield images of T-LBL cells on ZKS stromal cells after 7 days of culture following serial dilution and plating (A-E and G-K), or after 8 days in hypoxic conditions (F and L). All FACS-sorted tumor cells were either from 7 Myc;Cre;bcl-2 T-LBL (top row) or Myc;Cre T-LBL (bottom row) transgenic fish. (M) Ratio of aggregates over free cells for tumor cell cultures when diluted 1:1 (black bars), 1:2 (gray bars), 1:4 (light gray bars), 1:8 (white bars), and 1:16 (black hatched bars), and grown for 7 days: Myc;Cre T-LBL (n=3; P=0.017 for 1:1 dilution; P=0.00185 for 1:2 dilution), Myc;Cre;bcl-2 T-LBL (n=4), Myc;Cre;bcl-2 T-ALL (n=4; P=0.0004 for 1:1 dilution; P=0.0021 for 1:2 dilution; P=0.017 for 1:4 dilution ), or Myc;Cre;bcl-2;Myr-Akt2 T-ALL (n=5; P=0.0018 for 1:1 dilution; P=0.0137 for 1:2 dilution; P=0.028 for 1:4 dilution ) transgenic fish. (N) Average diameters of cells under hypoxic (gray) and normal (black) culture conditions for Myc;Cre;bcl-2 vs. Myc;Cre tumor cells (mean ± SD μm diameter of cell under normal conditions: 1.79 ± 0.59 vs. 3.33 ± 1.50; n=110 for each group, P<0.0001; mean ± SD μm diameter of cell under hypoxic conditions: 1.62 ± 0.55 vs. 3.30 ± 1.46; n=110 for each group, P<0.0001;). (O) Fold change in viable lymphoma or leukemic cells between 1 and 7 days postculture on ZKS stroma cells from Myc;Cre T-LBL (dark gray bar, n=3), Myc;Cre;bcl-2 T-LBL (light gray bar, n=4), Myc;Cre;bcl-2;Akt2 (white bar, n=5), and Myc;Cre;bcl-2 T-ALL (black bar, n=4) transgenic fish. (P) Percentage of Annexin V-positive cells from whole kidney marrow (WKM; black bar), Myc;Cre T-LBL (dark gray bar, n=3), Myc;Cre;bcl-2 T-LBL (light gray, n=4), Myc;Cre;bcl-2;Akt2 (white bar, n=5), and Myc;Cre;bcl-2 T-ALL (black bar, n=4) cells after 7 days in culture. Data are reported as means ± SD. Scale bar for panels A-L = 40 μm. |
Reprinted from Cancer Cell, 18(4), Feng, H., Stachura, D.L., White, R.M., Gutierrez, A., Zhang, L., Sanda, T., Jette, C.A., Testa, J.R., Neuberg, D.S., Langenau, D.M., Kutok, J.L., Zon, L.I., Traver, D., Fleming, M.D., Kanki, J.P., and Look, A.T., T-lymphoblastic lymphoma cells express high levels of BCL2, S1P1, and ICAM1, leading to a blockade of tumor cell intravasation, 353-366, Copyright (2010) with permission from Elsevier. Full text @ Cancer Cell

