
|
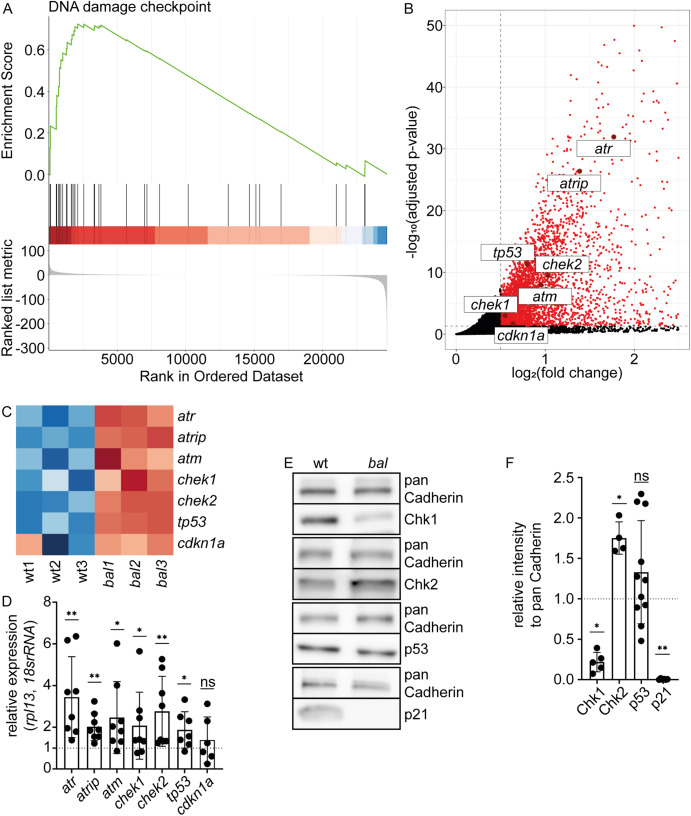
Fig. 3 p21, a key regulator of DNA damage response, is lost in baldrian mutants (A) Gene set enrichment analysis plot of the Gene Ontology term “DNA damage checkpoint” visualizes that upregulated genes are overrepresented in this gene set in baldrian mutants (ES = 0.72, normalized ES = 1.70, adjusted p-value = 0.0069). (B) Zoom-in of the Volcano plot showing significantly upregulated genes in baldrian mutants in red (adjusted p-value<0.05, log2(FC) > 0.5) and genes of interest labeled with their gene name. (C) Heatmap of selected genes color-coding the expression in the different RNA-sequencing samples. Red indicates increased and blue decreased expression. (D) Quantification of quantitative real-time PCR (qRT-PCR) verifying the results obtained by RNA-seq (atr 3.45 ± 1.94, n = 8, atrip 2.02 ± 0.66, n = 8, atm 2.46 ± 1.72, n = 8, chek1 2.08 ± 1.61, n = 8, chek2 2.76 ± 1.68, n = 8, tp53 1.87 ± 0.87, n = 7, cdkn1a/p21 1.39 ± 1.10, n = 6, Wilcoxon test, ns: p > 0.05, ∗p < 0.05, ∗∗p < 0.01). (E) Western Blot analysis of candidate proteins involved in DNA damage response comparing wt and bal protein lysates in comparison to pan Cadherin as loading control. (F) Quantification of protein levels normalized to pan Cadherin and the wt (Chk1 (gene chek1) 0.22 ± 0.12, n = 5, Chk2 (gene chek2) 1.75 ± 0.20, n = 4, p53 (gene tp53) 1.33 ± 0.64, n = 11, p21 (gene cdkn1a) 0.006 ± 0.006, n = 6, Mann-Whitney-test, ns: p > 0.05, ∗p < 0.05, ∗∗p < 0.01).