Image
Figure Caption

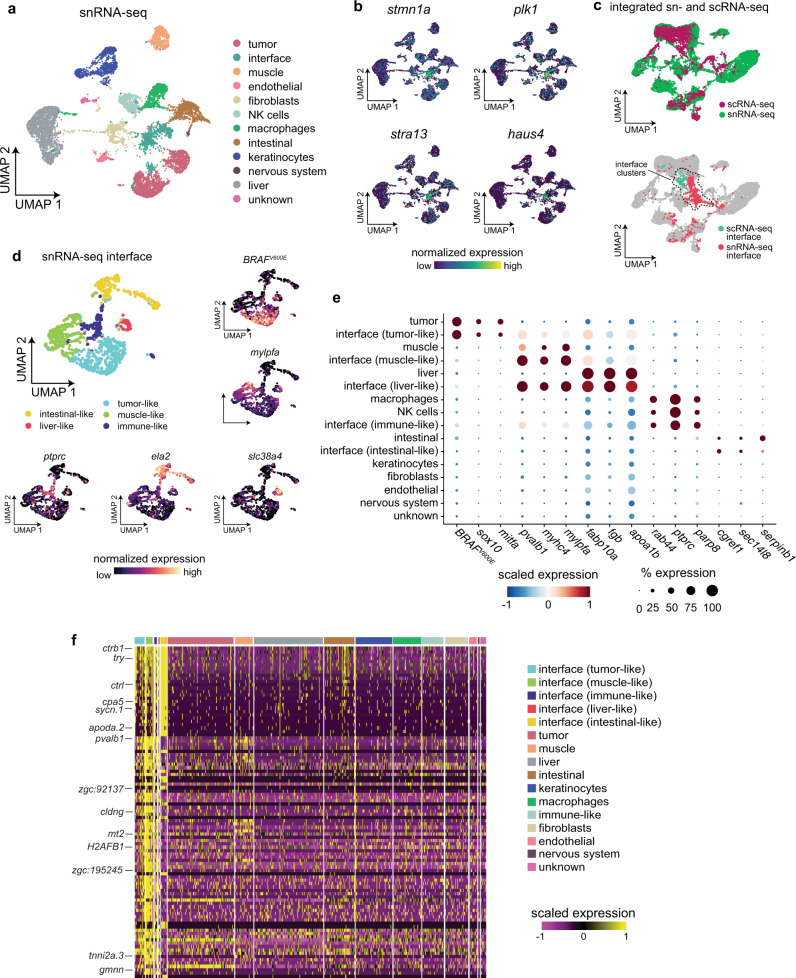
Fig. 4 Single-nucleus RNA-seq demonstrates that the interface cell states are distinct from the rest of the microenvironment.

a snRNA-seq cluster assignments plotted in UMAP space. b Expression of marker genes from the scRNA-seq interface cluster in the snRNA-seq dataset. c Integrated UMAP of the snRNA-seq and scRNA-seq datasets (labeled, top plot) showing colocalization of the two interface clusters (bottom plot). d Subcluster assignments and expression of marker genes from the snRNA-seq interface cluster. e Dotplot showing expression of microenvironment cell-type specific genes within the interface subclusters. f Heatmap showing expression of the top 100 genes upregulated across all of the interface subclusters.

Figure Data
Acknowledgments
This image is the copyrighted work of the attributed author or publisher, and ZFIN has permission only to display this image to its users. Additional permissions should be obtained from the applicable author or publisher of the image. Full text @ Nat. Commun.