
IMAGE
Fig. 1
Image
|
Figure Caption
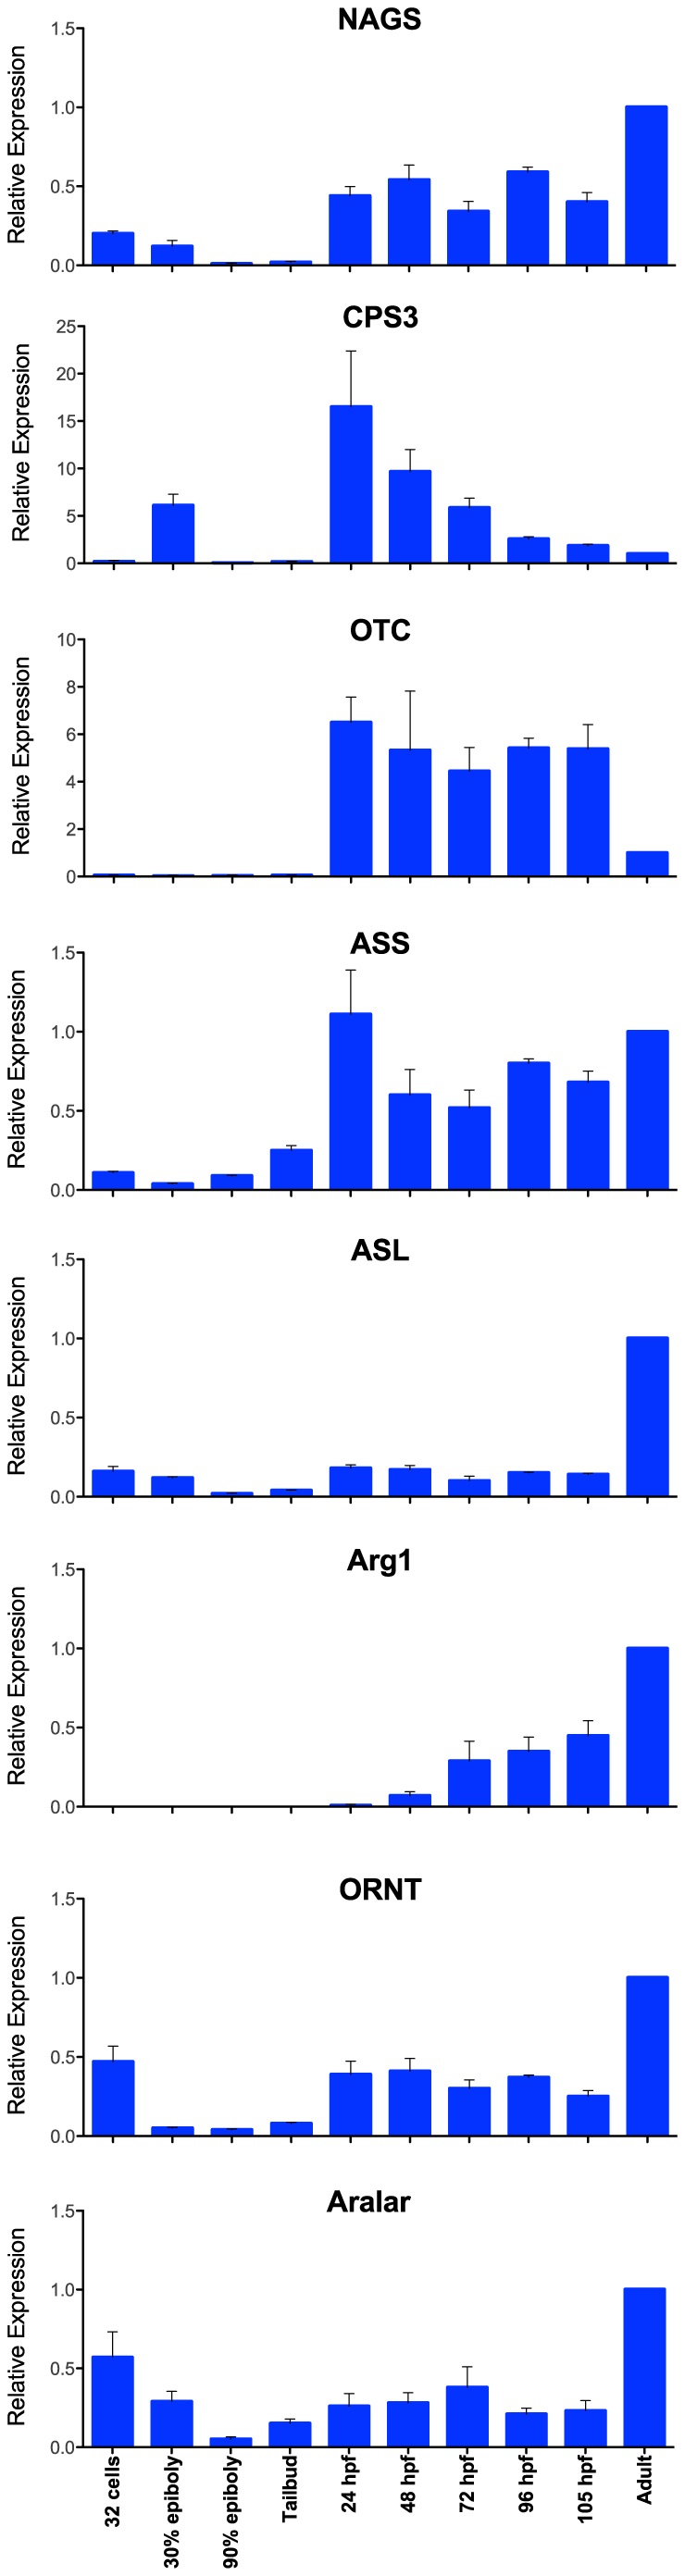
Fig. 1
Relative expression of urea cycle genes in developing zebrafish. mRNA levels were measured at nine developmental stages: 32 cells, 30% epiboly (4.6 hpf), 90% epiboly (9 hpf), tailbud (10 hpf), 24 hpf, 48 hpf, 72 hpf, 96 hpf, 105 hpf, and normalized to the abundance of each mRNA in adult zebrafish. The scales of y-axes differ due to different expression patterns of zebrafish urea cycle genes.
Figure Data
Acknowledgments
This image is the copyrighted work of the attributed author or publisher, and
ZFIN has permission only to display this image to its users.
Additional permissions should be obtained from the applicable author or publisher of the image.
Full text @ PLoS One