
Fig. 8
|
Fig. 8
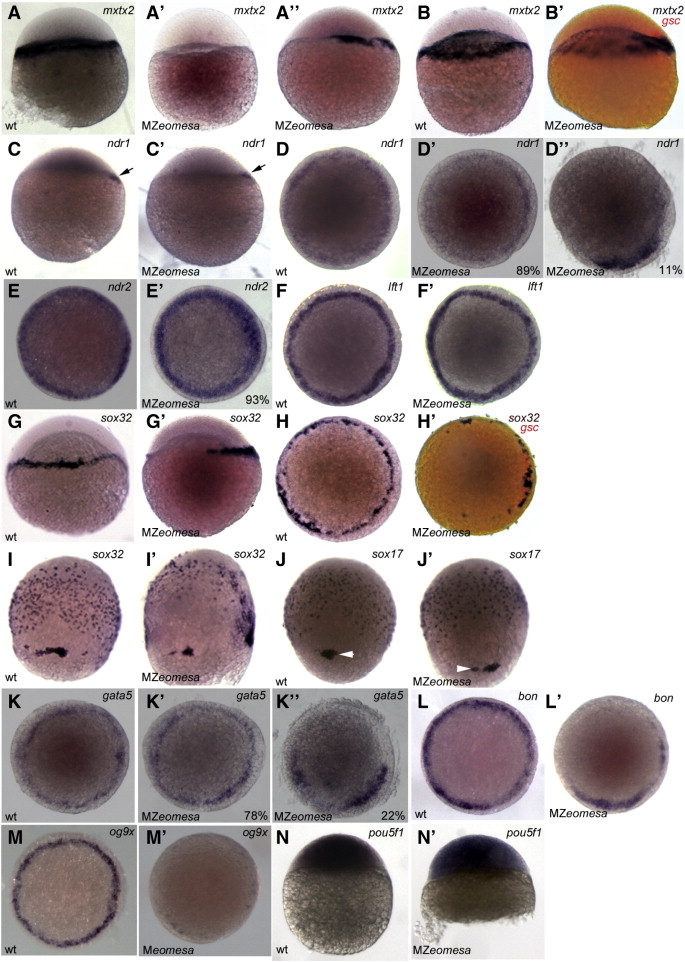
Expression of endoderm markers is reduced in MZeomesa embryos. (A-C′, G, G′, I-J′) lateral views, (D-F′, H, H′, K-M′) animal pole views of embryos stained by whole mount in situ hybridzation. (A-B′) mxtx2 expression at sphere (A-A′′) and dome stage. (B′) gsc in red marks dorsal. (C-D′′) ndr1 expression at sphere (arrow, C,C′) and 40% epiboly (D-D′′). (E, E′) ndr2 expression at 40% epiboly. (F,F′) lft1 expression at 40% epiboly (G-H′) sox32 expression at 40% epiboly, (H′) gsc in red marks dorsal. sox32 expression (I,I′) and sox17 expression (J,J′) at 75% epiboly. Arrowheads indicate dorsal forerunner cells. (K-K′′) gata5 expression at 40% epiboly. (L,L′) bon expression at 40% epiboly (M,M′) og9x expression at 40% epiboly. (N.N′) pou5f1 at oblong/sphere. Genotypes indicated in lower left, probe in upper right and percentages of embryos that exhibited given phenotype shown in lower right where appropriate.
Reprinted from Developmental Biology, 362(1), Du, S., Draper, B.W., Mione, M., Moens, C.B., and Bruce, A.E., Differential regulation of epiboly initiation and progression by zebrafish Eomesodermin A, 11-23, Copyright (2012) with permission from Elsevier. Full text @ Dev. Biol.