|
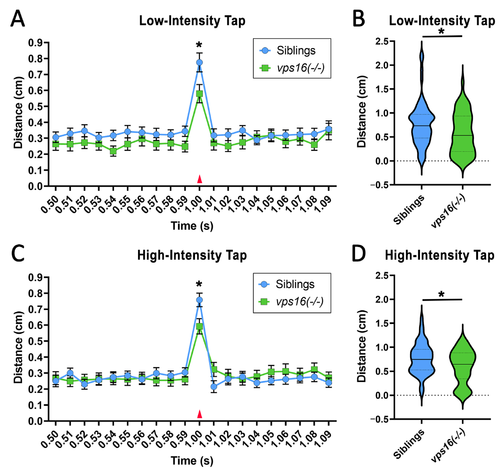
vps16(-/-) mutants at 7 dpf show significantly reduced distance traveled in response to single acoustic/tap stimulus at both low and high intensity. (A) Line graph representing average distance traveled by vps16(-/-) larvae (green, n = 56) and siblings (blue, n = 60) at 7 dpf in response to single low-intensity acoustic/tap stimulus (red arrow). (B) Violin plots representing average distance traveled by vps16(-/-) larvae (green, n = 56) and siblings (blue, n = 60) at 7 dpf in response to single low-intensity acoustic/tap stimulus. p < 0.05. (C) Line graph representing average distance traveled by vps16(-/-) larvae (green, n = 53) and siblings (blue, n = 58) at 7 dpf in response to single high-intensity acoustic/tap stimulus (red arrow). (D) Violin plots representing average distance traveled by vps16(-/-) larvae (green, n = 53) and siblings (blue, n = 58) at 7 dpf in response to single high-intensity acoustic/tap stimulus. For all graphs, “*” = p < 0.05 and error bars indicate SEM.
|