FIGURE

Fig 7

ID
ZDB-FIG-240612-17
Publication
Prykhozhij et al., 2024 - miR-34a is a tumor suppressor in zebrafish and its expression levels impact metabolism, hematopoiesis and DNA damage
Other Figures
All Figure Page
Back to All Figure Page
Fig 7

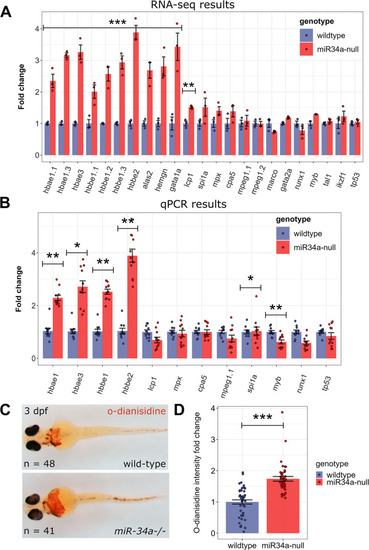
Analysis of blood cell type markers in 3 dpf wild-type and miR-34a-/- mutants reveals erythrocyte up-regulation in the mutants.

(A) Bar graph of normalized relative expression values of blood-related genes and tp53 in the 72 hpf RNA-seq dataset comprising data on 3 wild-type and miR-34a-/- RNA samples. (B) qPCR verification of the selected blood cell type markers on 3dpf wild-type and miR-34a-/- RNA samples (n = 10 and 11, respectively). Significantly different genes in (A) and (B) determined by a two-sample t-test with multiple-testing adjustment are indicated by ‘***’ (P-value < 0.001), ‘**’ (P-value < 0.01) and ‘*’ (P-value < 0.05). (C) Representative ventral images of o-dianisidine stained embryos at 3 dpf of both genotypes. The numbers of larvae are indicated. The staining was performed on embryos from two independent samples. (D) Quantification of o-dianisidine staining on 3dpf wild-type and miR-34a-/- larvae (n = 48 and 42, respectively) using the ilastik-Cell Profiler pixel classification approach. Relative values of “Mean Intensity after thresholding” positively classified pixels are shown. The significance of the differences between the genotypes was calculated by the two-sample t-test (***; P-value < 9.956e-07).

Expression Data

Expression Detail
Antibody Labeling
Phenotype Data

Phenotype Detail
Acknowledgments
This image is the copyrighted work of the attributed author or publisher, and ZFIN has permission only to display this image to its users. Additional permissions should be obtained from the applicable author or publisher of the image. Full text @ PLoS Genet.