FIGURE SUMMARY
Title

miR-34a is a tumor suppressor in zebrafish and its expression levels impact metabolism, hematopoiesis and DNA damage

Authors
Prykhozhij, S.V., Ban, K., Brown, Z.L., Kobar, K., Wajnberg, G., Fuller, C., Chacko, S., Lacroix, J., Crapoulet, N., Midgen, C., Shlien, A., Malkin, D., Berman, J.N.
Source
Full text @ PLoS Genet.

Conservation, genomic synteny and expression timing of microRNA-34 family members in zebrafish.

(A) Multiple sequence alignment of human (hsa) and zebrafish (dre) microRNA-34 (a, b, c) sequences. Identical nucleotides are marked with “*” in the consensus and in green. Nearly identical nucleotides (in 5 out of 6 microRNAs) are highlighted in yellow. The seed sequences are surrounded by red boxes. A cladogram showing phylogenetic relatedness of these microRNAs is shown next to microRNA names. (B) Synteny of genomic miRNA-34a regions in zebrafish and human. Start positions of the genes are marked with small rectangles (red for miR-34a and green for all other genes). (C) Synteny of miR-34b/c cluster location next to the btg4/BTG4 gene in zebrafish and humans. The miR-34b and miR-34c primary transcripts in both species are indicated with red rectangles and btg4/BTG4 exons are shown in green. MIR34B and MIR34C transcripts in human consist of a single exon shown by a rectangle with a black outline. Promoter regions are indicated with directed arrows. The opposite orientation of the promoters for the miR-34b/c cluster and btg4/BTG4 gene is also conserved from zebrafish to humans. (D) Quantitative real-time PCR analysis of the relative expression of miR-34a,b,c at different stages of zebrafish development. Triplicate biological samples of each stage and duplicate technical replicates were used for the analysis. The expression levels were normalized using 18S rRNA expression and the relative levels of all samples and genes were calculated relative to the level of miR-34a at 24 hpf. (E) Agarose gel analysis of semi-quantitative RT-PCRs of miR-34a,b,c transcripts at 48, 72 and 96 hpf stage zebrafish cDNAs synthesized with either random 9-mer or oligo-dT oligos.

p53 induces all miR-34 genes in zebrafish but with different kinetics.

(A) Quantitative PCR (qPCR) analysis of miR-34 genes (miR-34a, miR-34b, miR-34c) as well as p53 target genes p21 and cycG1 after 1, 2, 4 and 5 hours of treatments at 24 hpf with 0.1% DMSO or 1μM camptothecin (CPT), which induces DNA damage and p53 activation. (B) qPCR analysis of miR-34 genes as well as p53 target genes p21 and cycG1 after 1 and 3 hours of treatments at 48 hpf with 0.1% DMSO or 1 μM CPT. (A, B) The qPCR experiment was run with 4 biological replicates and 2 technical replicates. (C) Whole mount in situ hybridization analysis of miR-34a expression pattern after 4-hour treatment with DMSO or CPT in wild-type zebrafish embryos. Representative images of 40 embryos stained per condition are shown. (D) qPCR for p53 target genes (p53, p21) and miR-34 genes in wild-type and p53 null mutants after a 4-hour treatment at 24 hpf with either 0.1% DMSO or 1μM CPT. The qPCR experiment was run with 7 or 8 biological replicates and 2 technical replicates. Fold changes for each gene are indicated on the log10-scaled y-axis relative to control. Standard errors are used for error bars. Significantly different genes in (A, B, D) are indicated by ‘***’ (P-value < 0.001), ‘**’ (P-value < 0.01) and ‘*’ (P-value < 0.05). (E) Positions and alignments of the p53 transcription factor motif in the 20-kb regions around the miR-34a and miR-34b/c genes performed using the MAST software. The alignment figure position above or below the genomic sequence line indicates the strand (+ or -, respectively). The P-values for the motif matches are indicated on the alignment inserts.

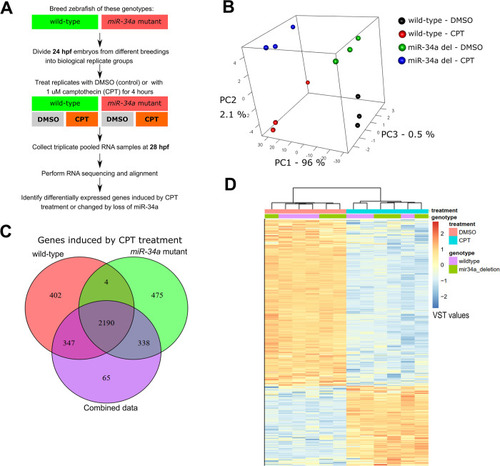
p53 activation by camptothecin treatment induces massive gene expression effects with a small contribution from miR-34a.

(A) Experimental design of the RNA sequencing experiment to analyze how miR-34a loss affects gene expression under normal and DNA damage treatment conditions. (B) Principal component analysis of gene expression values in all RNA sequencing samples. (C) Venn diagram for differentially expressed genes (DEGs) (fold-change ≥ 2 and FDR ≤ 0.05 as cut-offs) in the combined dataset (both genotypes), wild-type and miR-34a mutant subsets. (D) Hierarchical clustering of variance-stabilized transformed normalized counts (VST values) for all DEGs based on the treatment factor in full dataset. Treatment and genotype assignments are indicated at the top of the gene expression heatmap and the legend for the heatmap is shown to the right.

Expression changes due to loss of miR-34a identified by RNA-seq at 28 hpf.

(A) Heatmap of variance-stabilized transformed normalized counts (VST values) in miR-34a deletion mutant relative to wild-type. The expression changes were determined by comparison of wild-type and miR-34a deletion mutant samples under DMSO-treated conditions and the heatmaps show all types of samples for completeness. (B) Clustering of Gene Ontology (GO) and KEGG terms as well as genes associated with them.

Tumor development due to tp53 mutations in zebrafish is enhanced by loss of miR-34a.

(A) Kaplan-Meier survival curves for tp53-/- and miR-34a-/-;tp53-/- zebrafish. (B) Kaplan-Meier survival curves for tp53R217H/R217H and miR-34a-/-;tp53R217H/R217H zebrafish. (C, D) Anatomical categorization of the tumors in zebrafish adults of the genotypes shown in (A, B). Broad anatomical categories are shown, which are not precisely related to the histological tumor types; ‘Other’ indicates that a fish had a cancer-related pathology such as a possible leukemia, but no visible tumor. (E) Hematoxylin-eosin staining of selected tumors identified during the tumor watch experiment. Each row shows 3 examples from the zebrafish of the indicated genotype on the first image in each row. For each tumor low (20x) and high-magnification (200x) images are shown as well as an inset of gross morphology of the zebrafish analyzed for tumor histology.

Expression profiling by RNA-seq of wild-type vs miR-34a-/- embryos at 8 and 72 hpf.

(A) Multi-dimensional scaling (MDS) 2-dimensional projection of RNA-seq count matrices for all samples. (B) Heatmaps of variance-stabilized transformed normalized counts (VST values) for samples at both stages with the numbers of genes up-regulated (UP) and down-regulated (DOWN) in miR-34a-/-. (C) KEGG pathway analysis for DEGs identified in the 8 hpf dataset. (D) KEGG pathway analysis for DEGs identified in the 72 hpf dataset. DEGs in 8 hpf and 72 hpf datasets were defined with fold-change ≥ 2 and FDR ≤ 0.05 as cut-offs. (E) REVIGO plot of Gene Ontology Biological Process terms identified for up-regulated genes in the 72 hpf dataset. (F) REVIGO plot of Gene Ontology Biological Process terms identified for down-regulated genes in the 72 hpf dataset. (G) Anatomical term enrichment using Zebrafish Expression Ontology of Gene Sets (ZEOGS) of both UP and DOWN-regulated genes in the 72 hpf dataset. Orange color indicates FDR q-value < 0.1 significance after Benjamini-Hochberg correction and green indicates P-value < 0.1 before correction.

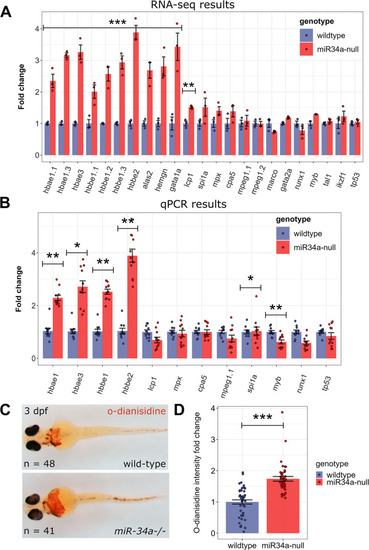
Analysis of blood cell type markers in 3 dpf wild-type and miR-34a-/- mutants reveals erythrocyte up-regulation in the mutants.

(A) Bar graph of normalized relative expression values of blood-related genes and tp53 in the 72 hpf RNA-seq dataset comprising data on 3 wild-type and miR-34a-/- RNA samples. (B) qPCR verification of the selected blood cell type markers on 3dpf wild-type and miR-34a-/- RNA samples (n = 10 and 11, respectively). Significantly different genes in (A) and (B) determined by a two-sample t-test with multiple-testing adjustment are indicated by ‘***’ (P-value < 0.001), ‘**’ (P-value < 0.01) and ‘*’ (P-value < 0.05). (C) Representative ventral images of o-dianisidine stained embryos at 3 dpf of both genotypes. The numbers of larvae are indicated. The staining was performed on embryos from two independent samples. (D) Quantification of o-dianisidine staining on 3dpf wild-type and miR-34a-/- larvae (n = 48 and 42, respectively) using the ilastik-Cell Profiler pixel classification approach. Relative values of “Mean Intensity after thresholding” positively classified pixels are shown. The significance of the differences between the genotypes was calculated by the two-sample t-test (***; P-value < 9.956e-07).

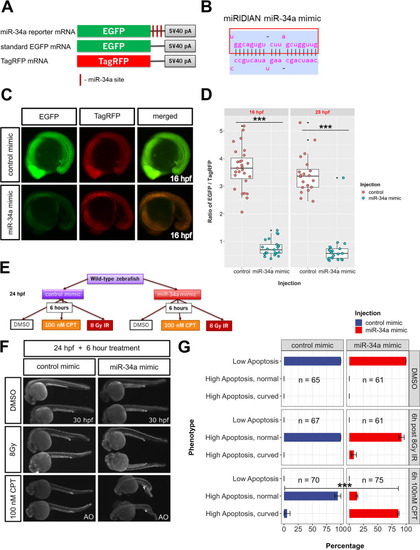
Transient overexpression of miR-34a sensitizes zebrafish embryos to camptothecin treatment.

(A) mRNAs used for demonstrating miR-34a-mediated repression. miR-34a reporter RNA contains 3 miR-34a sites, which are anti-sense to the miR-34a sequence. EGFP mRNA is a control mRNA for the miR-34a reporter mRNA. TagRFP mRNA is used for normalizing injections. (B) Structure of the miRIDIAN miR-34a mimic. (C) Imaging of miR-34a reporter EGFP injected with a control or miR-34a mimic. (D) Quantification of EGFP/TagRFP signal ratios after control and miR-34a mimic injection at 16 and 28 hpf stages. Two-sample t-tests at both stages have P-values < 0.001 (***). (E) Experimental plan for testing how miR-34a overexpression affects the apoptotic phenotype after DNA damage by gamma-irradiation or by 100 nM camptothecin treatment. (F) Apoptosis and morphology imaging of zebrafish embryos at 30 hpf treated according to the plan in (E) using Acridine Orange (AO). (G) Quantification of the results of DNA damage treatments with a control or miR-34a mimic. Chi-square test on the 100 nM data produced P-value <10−15 as indicated (***).

Acknowledgments
This image is the copyrighted work of the attributed author or publisher, and ZFIN has permission only to display this image to its users. Additional permissions should be obtained from the applicable author or publisher of the image. Full text @ PLoS Genet.