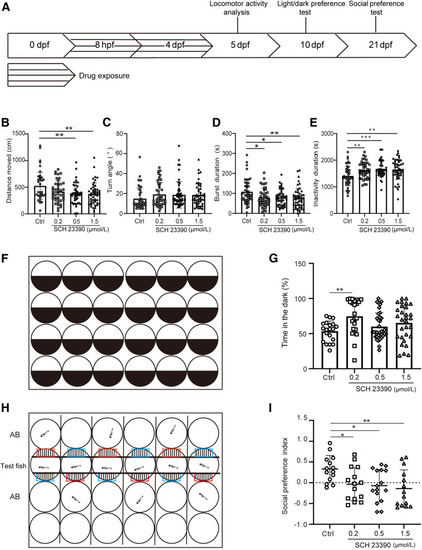
Behavioral analyses in zebrafish with disrupted dopaminergic signaling during development. A: Schematic diagram of the behavioral assays conducted in zebrafish. B–E: Locomotor activity analysis in the control group and embryos treated with SCH 23390, including distance moved (B), turn angle (C), burst duration (D), and inactivity duration (E). Statistical analysis of distance moved, burst duration, turn angle, and inactivity duration was performed using one-way analysis of variance. For distance moved, a significant overall effect was found [F(3,181) = 4.966]. The Dunnett test revealed significant differences between the control group and the 0.5 μmol/L and 1.5 μmol/L SCH 23390–treated groups, but no significant difference was observed between the control and the 0.2-μmol/L group (P = 0.0556). Turn angle analysis revealed no significant overall effect [F(3,182) = 1.243; P = 0.2955]. Burst duration analysis showed significant differences between the control group and each treated group (0.2, 0.5, and 1.5 μmol/L) [F(3,178) = 4.189]. Inactivity duration analysis showed a significant overall effect [F(3,181) = 5.940], with the control group differing significantly from the SCH 23390–treated groups (0.2, 0.5, and 1.5 μmol/L). Locomotion was recorded using the EthoVision XT video tracking software. Outliers were removed. No more than 5 samples in each group were removed. The locomotor activity was recorded for 40 minutes. F: Schematic diagram for the light/dark preference test, which lasted 10 minutes. G: Percentage of time in the dark side (n = 20, 23, 36, and 30, respectively) at 10 dpf showed a significant overall effect [F(3,105) = 3.865]. The Dunnett test revealed significant differences between the control group and the 0.2-μmol/L SCH 23390–treated groups, with no statistical difference between the control and 0.5- or 1.5-μmol/L groups (P = 0.05428, P = 0.1467, respectively). H: Experimental diagram of the social preference test, which lasted 15 minutes. I: Quantification of the social preference index, calculated as follows: (time spent in the conspecific zone - time spent in the empty side)/the total time spent in both zones. Each zone was 3.5 mm × 10 mm. Sample sizes were 14, 15, 16, and 14, respectively. Social preference analysis showed significant differences between the control and each treated group (0.2, 0.5, and 1.5 μmol/L) (P = 0.038, P = 0.0188, and P = 0.0065, respectively; analysis of variance, F(3,55) = 4.128, P = 0.0104), determined using the Dunnett test after one-way analysis of variance. ∗P < 0.05, ∗∗P < 0.01, and ∗∗∗P < 0.001. AB, wild-type zebrafish strain; Ctrl, control; dpf, days after fertilization; hpf, hours after fertilization.
|

