- Title
-
Developmental dopaminergic signaling modulates neural circuit formation and contributes to autism spectrum disorder (ASD)-related phenotypes
- Authors
- Lu, X., Song, Y., Wang, J., Cai, Y., Peng, S., Lin, J., Lai, B., Sun, J., Liu, T., Chen, G., Xing, L.
- Source
- Full text @ Am. J. Pathol.
|
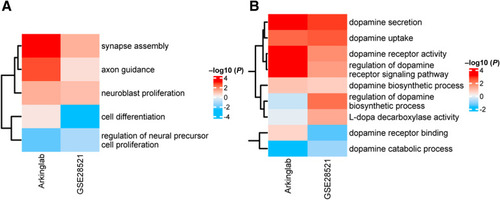
A and B: Expression changes in development-related gene sets (A) and dopaminergic gene sets (B) in the GSE28521 data set (https://www.ncbi.nlm.nih.gov/geo) and the Arkinglab data set (http://www.arkinglab.org/resources). Red depicts up-regulation, and blue denotes down-regulation. Gene expression changes with P < 0.05 are shown. |
|
Associations between changes in development-related gene sets and dopaminergic gene sets. A–C: Associations in the GSE28521 data set (https://www.ncbi.nlm.nih.gov/geo) (A), subjects ≤18 years old (subject number: 59) in the Arkinglab data set (http://www.arkinglab.org/resources) (B), and subjects ≤10 years old (subject number: 28) in the Arkinglab data set (C). Orange depicts a positive association, and blue shows a negative association. |
|
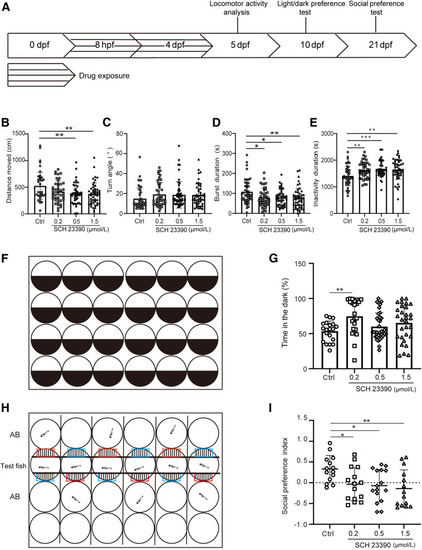
Behavioral analyses in zebrafish with disrupted dopaminergic signaling during development. A: Schematic diagram of the behavioral assays conducted in zebrafish. B–E: Locomotor activity analysis in the control group and embryos treated with SCH 23390, including distance moved (B), turn angle (C), burst duration (D), and inactivity duration (E). Statistical analysis of distance moved, burst duration, turn angle, and inactivity duration was performed using one-way analysis of variance. For distance moved, a significant overall effect was found [F(3,181) = 4.966]. The Dunnett test revealed significant differences between the control group and the 0.5 μmol/L and 1.5 μmol/L SCH 23390–treated groups, but no significant difference was observed between the control and the 0.2-μmol/L group (P = 0.0556). Turn angle analysis revealed no significant overall effect [F(3,182) = 1.243; P = 0.2955]. Burst duration analysis showed significant differences between the control group and each treated group (0.2, 0.5, and 1.5 μmol/L) [F(3,178) = 4.189]. Inactivity duration analysis showed a significant overall effect [F(3,181) = 5.940], with the control group differing significantly from the SCH 23390–treated groups (0.2, 0.5, and 1.5 μmol/L). Locomotion was recorded using the EthoVision XT video tracking software. Outliers were removed. No more than 5 samples in each group were removed. The locomotor activity was recorded for 40 minutes. F: Schematic diagram for the light/dark preference test, which lasted 10 minutes. G: Percentage of time in the dark side (n = 20, 23, 36, and 30, respectively) at 10 dpf showed a significant overall effect [F(3,105) = 3.865]. The Dunnett test revealed significant differences between the control group and the 0.2-μmol/L SCH 23390–treated groups, with no statistical difference between the control and 0.5- or 1.5-μmol/L groups (P = 0.05428, P = 0.1467, respectively). H: Experimental diagram of the social preference test, which lasted 15 minutes. I: Quantification of the social preference index, calculated as follows: (time spent in the conspecific zone - time spent in the empty side)/the total time spent in both zones. Each zone was 3.5 mm × 10 mm. Sample sizes were 14, 15, 16, and 14, respectively. Social preference analysis showed significant differences between the control and each treated group (0.2, 0.5, and 1.5 μmol/L) (P = 0.038, P = 0.0188, and P = 0.0065, respectively; analysis of variance, F(3,55) = 4.128, P = 0.0104), determined using the Dunnett test after one-way analysis of variance. ∗P < 0.05, ∗∗P < 0.01, and ∗∗∗P < 0.001. AB, wild-type zebrafish strain; Ctrl, control; dpf, days after fertilization; hpf, hours after fertilization. PHENOTYPE:
|
|
The effects of disrupted dopaminergic signaling during development on neural circuit formation. A, C, and E: Tubulin immunostaining in the control group, dopamine antagonist–treated group (0.2 μmol/L SCH 23390), and otp mutant zebrafish at 48 hours after fertilization. The lines indicate the measurement of anterior commissure (AC) and post-optic commissure (POC) in the midline, respectively. B, D, and F: SV2 immunostaining in the control group, dopamine antagonist–treated group (0.2 μmol/L SCH 23390), and otp mutant zebrafish at 48 hours after fertilization. The embryo was oriented in rostral-caudal axis, and the rostral part was on top. The irregular shape along the outer edge of synaptic vesicle glycoprotein 2A (SV2) staining was used to measure the area in the AC or POC region. G and H: Quantification of AC and POC width stained by tubulin. Significant differences in AC [analysis of variance, F(2,15) = 5.058] and POC widths [analysis of variance, F(2,15) = 10.54], stained with tubulin, were observed between the control and SCH 23390–treated groups (df = 15) and the control and otp knockout (KO) groups (df = 15) as determined by one-way analysis of variance followed by the Dunnett test. I and J: Quantification of area in the AC [analysis of variance, F(2,14) = 13.85] and POC regions [analysis of variance, F(2,14) = 3.651; P = 0.053] stained by SV2. Significant differences were observed between the control and SCH 23390–treated or KO otp groups using one-way analysis of variance followed by the Dunnett multiple comparisons test. No significant differences were found in the normalized area of the POC among the three groups. ∗P < 0.05, ∗∗P < 0.01, and ∗∗∗P < 0.001. Scale bar = 50 μm. Ctrl, control. |
|
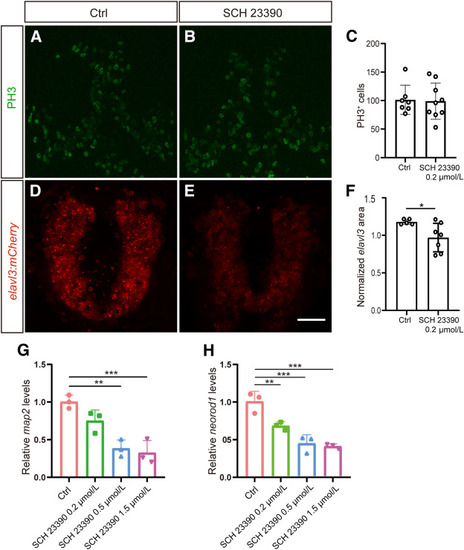
Disrupted dopaminergic signaling during development affects neuronal specification but not cell proliferation. A and B: Immunofluorescence images showing the expression of phosphorylated histone H3 (PH3) in the control group (A) and the drug-treated group (B). PH3 is a marker for mitotic cells. C: Quantification of the number of PH3+ cells in the control and drug-treated groups. The comparison between the control (Ctrl) and SCH 23390 groups for PH3 number was conducted using an unpaired t-test, revealing no significant difference (P = 0.8712). D and E: Live imaging of Tg(elavl3:mCherry), elavl3 is a pan-neuronal marker, in the forebrain of the control and SCH 23390–treated group. F: Significant differences in normalized elavl3 area were observed between the control and SCH 23390 groups (t = 2.399, df = 10, P = 0.0374, unpaired t-test). Data are presented as means ± SD. n = 7 (Ctrl) and 9 (SCH 23390 0.2 μmol/L) (C and F–H). G and H: Quantitative real-time PCR revealed mRNA levels of two neuronal markers map2 and neurod1. ∗P < 0.05, ∗∗P < 0.01, ∗∗∗P < 0.001. Scale bar = 50 μm. |
|
Impact of a dopamine antagonist on dopaminergic and serotonergic neuron specification in zebrafish brain at 72 hours after fertilization. A and B: Tyrosine hydroxylase (TH) immunostaining in the control group (A) and in the dopamine antagonist–treated group (B). C: Quantification of TH-positive neurons in the diencephalic dopaminergic cluster (DDC). Significant differences in the normalized area of TH-positive neurons in the DDC were observed between the control and SCH 23390–treated groups (df = 12) using an unpaired t-test. D and E: 5-hydroxytryptamine (5-HT) immunostaining in the control group (D) and in the dopamine antagonist–treated group (E). F: Normalized quantification of 5-HT neurons in the raphe. Significant differences in the normalized area of serotonin (5-HT)-positive neurons in the raphe nucleus were observed between the control and SCH 23390–treated groups (df = 8). ∗P < 0.05. Scale bar = 100 μm. Ctrl, control. EXPRESSION / LABELING:
PHENOTYPE:
|
|
Potential targets of dopaminergic signaling during development. A: Volcano plots depicting the differentially expressed genes (DEGs) between control and SCH 23390–treated groups. B: Gene Ontology (GO) term analysis of DEGs between the control and SCH 23390–treated groups. GO terms are based on the Gene Ontology website (https://geneontology.org, last accessed August 2020). C and D: Relative mRNA levels of two cell adhesion molecules: pcdh1g9 and itga6b. E: Elavl3 normalized area showed significant differences between control (Ctrl) and SCH 23390 (SCH) groups. and between SCH+Pyrintegrin and SCH 23390 alone (Bonferroni multiple comparisons test, df = 13). Error bars represent SD. F–H: Live imaging of Tg(elavl3:mCherry) in the forebrain of the control, SCH 23390–treated group, and SCH 23390+Pyrintegrin–treated group. The embryo was oriented in rostral-caudal axis, and the rostral part was on top ∗P < 0.05, ∗∗P < 0.01, ∗∗∗P < 0.001, and ∗∗∗∗P < 0.0001. Scale bar = 50 μm. |


