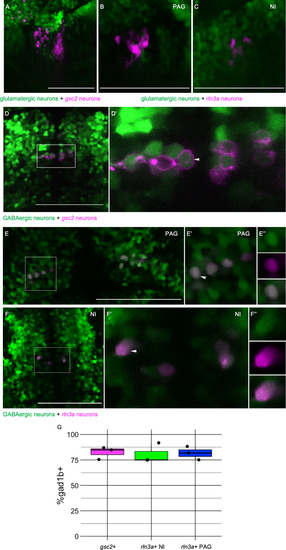
Figure 3.

rln3a and gsc2 NI neurons are largely GABAergic.

(A-F’’) Confocal images of 6 dpf larvae. (A–C) Lateral views, anterior left. (D-F’’) Dorsal views, anterior to the top. (A) Z-projection of Tg(gsc2:QF2)c721; Tg(QUAS:GFP)c578; Tg(slc17a6b:DsRed)nns9 larva. (B-F’’) Optical sections. (B) PAG and (C) NI of a Tg(rln3a:QF2, he1.1:YFP)c836; Tg(QUAS:mApple, he1.1:CFP)c788; Tg(slc17a6b:GFP)zf139 larva. (D) Tg(gsc2:QF2)c721; Tg(QUAS:mApple-CAAX, he1.1:mCherry)c636; TgBac(gad1b:GFP)nns25 larva. (D’) Magnified view of boxed region in D. White arrowhead indicates a gad1b and gsc2 co-expressing neuron. (E-F’’) Tg(rln3a:QF2, he1.1:YFP)c836; Tg(QUAS:mApple, he1.1:CFP)c788; TgBac(gad1b:GFP)nns25 larva. (E-E’’) View of PAG. (F-F’’) View of NI. (E’, F’) Magnified views of boxed regions in E and F. (E’’, F’’) Individual neurons indicated by arrowheads in E’ and F’, respectively. Top panels: GABAergic, middle panels: rln3a, bottom panels: composite. (G) Boxplot showing the percentage of gsc2 and rln3a NI neurons, and rln3a PAG neurons that express TgBac(gad1b:GFP)nns25, n=3 larvae. Scale bars, 100 µm.

Expression Data

Expression Detail
Antibody Labeling
Phenotype Data

Phenotype Detail
Acknowledgments
This image is the copyrighted work of the attributed author or publisher, and ZFIN has permission only to display this image to its users. Additional permissions should be obtained from the applicable author or publisher of the image. Full text @ Elife