FIGURE SUMMARY
Title

Genetically defined nucleus incertus neurons differ in connectivity and function

Authors
Spikol, E.D., Cheng, J., Macurak, M., Subedi, A., Halpern, M.E.
Source
Full text @ Elife

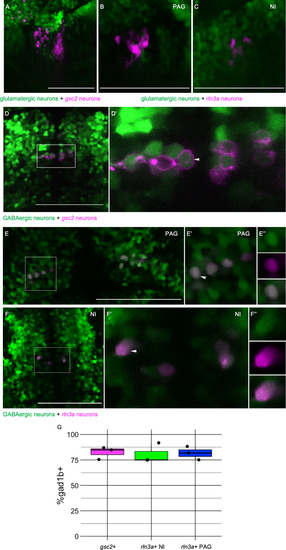
gsc2 neurons localize to the nucleus incertus. (A, A’) WISH for gsc2 and (B-C’) double-label WISH for (B, B’) gsc2 and sst1.1 or (C, C’) gsc2 and rln3a was performed on (A-B’) 4 days post-fertilization (dpf) or (C, C’) 6 dpf larvae. (A, C, C’) Dorsal views, anterior to the top. (A’, B, B’) Lateral views, anterior left. (B’, C’) Enlarged views of boxed regions in B and C, respectively. Scale bars, 100 µm. (D–F) Fluorescent double-label WISH for (D) rln3a and gsc2, (E) rln3a and nmbb, and (F) rln3a and cckb. Dorsal views of 6 dpf larvae, anterior to the top. Z-projections. Scale bar, 10 µm. (G) Schematic depicting distribution of neuronal subtypes in the nucelus incertus (NI) of larval zebrafish. Green dots, gsc2 expression; purple dots, rln3a expression; blue dots, nmbb expression; pink dots and shading, cckb expression. IPN: interpeduncular nucleus, PAG: periaqueductal grey, NI: nucleus incertus.

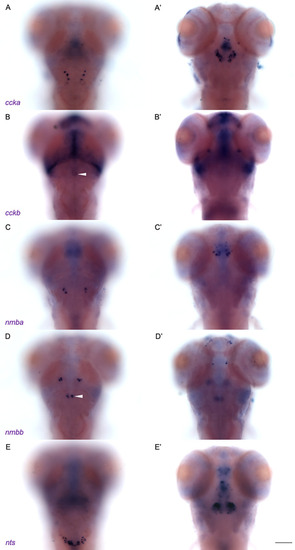
Subset of neuropeptides expressed in NI of larval zebrafish.

WISH for (
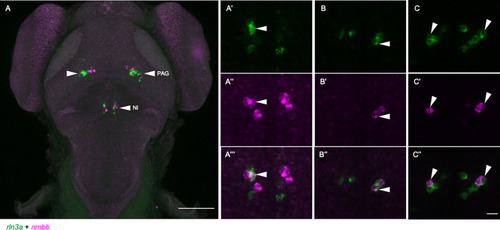
A-A’) ccka, (B-B’) cckb, (C-C’) nmba, (D-D’) nmbb and (E-E’) nts expression in 6 dpf larvae. Dorsal views of the same larvae were imaged at (A, B, C, D, E) dorsal and (A’, B’, C’, D’, E’) ventral planes, anterior to the top. White arrowheads indicate the NI. Scale bar, 100 µm.

Partially overlapping expression of rln3a and nmbb in the zebrafish NI.

Fluorescent double-label WISH for rln3a and nmbb transcripts. Dorsal views of 6 dpf larvae, anterior to the top. (A) Z-projection and (A’-A’’’) higher magnification image of NI from larva in A. (B-C’’) NI in two additional larvae. (A’-C’’) Optical sections showing neurons expressing (A’, B, C) rln3a, (A’’, B’, C’) nmbb and (A’’’, B’’, C’’) composite images. White arrowheads indicate neurons that co-express both genes. (A) Scale bar, 100 µm. (A’-C’’) Scale bar, 10 µm. PAG: periaqueductal gray, NI: nucleus incertus.

Transgenic driver lines recapitulate gsc2 and rln3a expression patterns. (A, D) CRISPR/Cas9 genome editing strategies used to generate (A) Tg(gsc2:QF2)c721 and (D) Tg(rln3a:QF2, he1.1:YFP)c836 driver lines. (B, C, E, F) Dorsal views of 6 dpf larvae, anterior to the top. (B, E) WISH for (B) gsc2 and (E) rln3a. (C, F) Confocal Z-projections of (C) Tg(gsc2:QF2)c721; Tg(QUAS:GFP)c578 and (F) Tg(rln3a:QF2, he1.1:YFP)c836; Tg(QUAS:GFP)c578 larvae. Scale bars, 100 µm. sgRNA: single guide RNA, hsp70: heat shock cognate 70-kd protein, tandem duplicate 1 promoter, 5’ UTR: 5’ untranslated region, HA: homology arm, he1.1: promoter of hatching enzyme gene.

QF2 driver lines recapitulate gsc2 and rln3a expression patterns in the adult brain.

Drawing of adult zebrafish brain in lateral view (after Wullimann et al., 1996), indicating positions of coronal sections (70 µm) shown in (B–G). (B, D, F) WISH for (B) gsc2 and (D, F) rln3a. (C, E, G) Confocal Z-projections of labeled neurons in (C) Tg(gsc2:QF2)c721; Tg(QUAS:GFP)c578 and (E, G) Tg(rln3a:QF2, he1.1:YFP)c836; Tg(QUAS:GFP)c578 brains. Anterior to the top. Dashed lines delineate ventricles and medial longitudinal fascicles (MLF). Scale bars, 100 µm. Ob: olfactory bulb, Tel: telencephalon, Hb: habenula, OT: optic tectum, IPN: interpeduncular nucleus, Ce: cerebellum, Md: medulla.

gsc2 neurons reside outside the IPN in the adult brain.

Drawing of adult zebrafish brain in lateral view (after Wullimann et al., 1996), indicating positions of sections shown in (B-D’). (B-D’) Two confocal optical sections are shown for each of three 70 µm vibratome slices from a representative TgBAC(gng8:Eco.NfsB-2A-CAAX-GFP)c375; Tg(gsc2:QF2)c721; Tg(QUAS:NLS-mApple)c718 adult brain. Sections are ordered from rostral to caudal with anterior to the top. Dashed lines delineate ventricles and the medial longitudinal fascicles (MLF). Arrowheads indicate mApple labeling of gsc2 neuronal projections to the hypothalamus in B and B’ and gsc2 cell bodies in C-D. Scale bar, 100 µm. Ob: olfactory bulb, Tel: telencephalon, Hb: habenula, OT: optic tectum, IPN: interpeduncular nucleus, Ce: cerebellum, Md: medulla.

rln3a and gsc2 NI neurons are largely GABAergic.

(A-F’’) Confocal images of 6 dpf larvae. (A–C) Lateral views, anterior left. (D-F’’) Dorsal views, anterior to the top. (A) Z-projection of Tg(gsc2:QF2)c721; Tg(QUAS:GFP)c578; Tg(slc17a6b:DsRed)nns9 larva. (B-F’’) Optical sections. (B) PAG and (C) NI of a Tg(rln3a:QF2, he1.1:YFP)c836; Tg(QUAS:mApple, he1.1:CFP)c788; Tg(slc17a6b:GFP)zf139 larva. (D) Tg(gsc2:QF2)c721; Tg(QUAS:mApple-CAAX, he1.1:mCherry)c636; TgBac(gad1b:GFP)nns25 larva. (D’) Magnified view of boxed region in D. White arrowhead indicates a gad1b and gsc2 co-expressing neuron. (E-F’’) Tg(rln3a:QF2, he1.1:YFP)c836; Tg(QUAS:mApple, he1.1:CFP)c788; TgBac(gad1b:GFP)nns25 larva. (E-E’’) View of PAG. (F-F’’) View of NI. (E’, F’) Magnified views of boxed regions in E and F. (E’’, F’’) Individual neurons indicated by arrowheads in E’ and F’, respectively. Top panels: GABAergic, middle panels: rln3a, bottom panels: composite. (G) Boxplot showing the percentage of gsc2 and rln3a NI neurons, and rln3a PAG neurons that express TgBac(gad1b:GFP)nns25, n=3 larvae. Scale bars, 100 µm.

Axonal projections of gsc2 neurons.

Rotating 3D reconstruction of a 6 dpf Tg(gng8:Eco.NfsB-2A-CAAX-GFP)c375; Tg(gsc2:QF2)c721; Tg(QUAS:mApple-CAAX, he1.1:mCherry)c636 larva generated using a Zeiss LSM 980 and Zen software. Hb-IPN pathway, green; gsc2 neurons, magenta. Anterior to the top.

gsc2 and rln3a NI neurons innervate different dorsoventral IPN regions.

(A-H’) Confocal images of 6 dpf larvae. (A-B, E-F’) TgBAC(gng8:Eco.NfsB-2A-CAAX-GFP)c375 and Tg(gsc2:QF2)c721 driving (A, A’) Tg(QUAS:NLS-mApple, he1.1:CFP)c718 or (B, E-F’) Tg(QUAS:mApple-CAAX, he1.1:mCherry)c636. (C-D, G-H’) TgBAC(gng8:GAL4FF)c426; Tg(UAS-E1B:NTR-mCherry)c264 and Tg(rln3a:QF2, he1.1:YFP)c836 driving (C, C’) Tg(QUAS:NLS-GFP, he1.1:CFP)c682 or (D, G-H’) Tg(QUAS:NLS-GFP, he1.1:CFP)c682 and Tg(QUAS:GFP-CAAX)c591. (A’, C’) Higher magnification images of larvae in A and C, respectively. (A, A’, C, C’) Z-projections. (B, D) optical sections. (A–D) Lateral views, anterior left. (E-H’) Dorsal views, anterior to the top. Optical sections at the level of the (E, E’, G, G’) dorsal IPN or (F, F’, H, H’) ventral IPN of the same larvae. (E’, F’, G’, H’) Labeled efferent projections only. (I, J) Confocal Z-projections of coronal sections (70 μm) through adult brains of (I) Tg(gsc2:QF2)c721; Tg(QUAS:GFP-CAAX; he1.1:YFP)c631 or (J) Tg(rln3a:QF2; he1.1:YFP)c836; Tg(QUAS:GFP-CAAX)c591 fish. Anterior to the top. (K) Schematic of the IPN showing distinct dorsoventral regions innervated by rln3a and gsc2 neurons. Scale bars, 100 µm. dIPN: dorsal IPN, vIPN: ventral IPN.

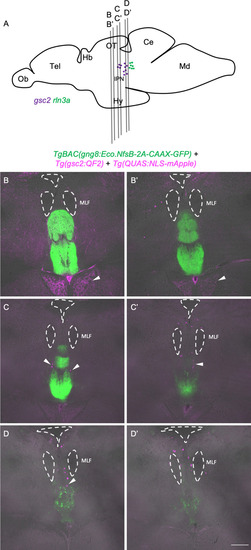
Increased calcium signaling in gsc2 neurons upon optogenetic activation of the dHb. Calcium transients were imaged at 2.6 Hz before, during, and after illumination with 561 nm light in 7 dpf larvae. (A) Drawings depicting imaging of calcium transients and optogenetic activation using confocal microscopy. (B-C’) Representative maximum intensity projections of GCaMP7a fluorescence in (B) dHb and (B’) gsc2 neurons of the same larva, or (C) dHb and (C’) rln3a NI neurons of the same larva. Anterior to the top. Scale bar, 100 μm. (D-E’’) Tg(gsc2:QF2)c721 or (F-H’’) Tg(rln3a:QF2, he1.1:YFP)c836 driver lines in (D-H) TgBAC(gng8:GAL4FF)c426; Tg(UAS:GCaMP7a)zf415; Tg(QUAS:GCaMP7a)c594 larvae (D, E, F, G, H) with or (D’, E’, F’, G’, H’) without Tg(UAS:ReaChR-RFP)jf50. The average change in GCaMP7a signaling (%ΔF/F) is shown for (D, D’, F, F’) the dorsal habenulae, (E, E’) gsc2 neurons, (G, G’) rln3a NI neurons, and (H, H’) rln3a PAG neurons. Shading indicates standard deviation. Gaps at light onset and offset are due to latency in switching the laser configuration. (D’’, E’’, F’’, G’’, H’’) Average Fpost/Fpre is shown for (D’’, F’’) the dHb, (E’’) gsc2 neurons, (G’’) rln3a NI neurons, and (H’’) rln3a PAG neurons of ReaChR+ and ReaChR- larvae. Fpost is the area under the curve for 15 frames (5.8 s) during 561 nm illumination and Fpre is the area under the curve for 15 frames (5.8 s) preceding 561 nm illumination. (D’’, E’’, F’’, G’’, H’’) Black bars indicate mean ratios: (D’’) 0.75±0.15, n=6 ReaChR- larvae, 2.95±0.41, n=5 ReaChR+ larvae, ***p=0.0004. (E’’) 1.07±0.15, n=6 ReaChR- larvae, 1.86±0.17, n=5 ReaChR+ larvae, **P=0.0073. (F’’) 1.22±0.29, n=5 ReaChR- larvae, 11.08±6.54, n=5 ReaChR+ larvae, *p=0.032. (G’’) 1.82±0.32, n=5 ReaChR- larvae, 1.97±0.59, n=5 ReaChR+ larvae, = 0.83. (H’’) 2.13±0.27, n=5 ReaChR- larvae, 1.83±0.27, n=5 ReaChR+ larvae, p=0.45. Extended y-axis in F’’ to display higher values.

Calcium signaling in individual larvae and neurons.

Examples of calcium transients recorded from (A, B, D, E, G, H, J, K, M, O) individual larvae and from (C, F, I, L, N, P) single neurons in additional larvae. Calcium signaling was imaged at 2.6 Hz before, during, and after illumination with 561 nm light in 7 dpf larvae. GCaMP7a signaling (%ΔF/F) is shown for (A, D, G, J) the dorsal habenulae, (B, C, E, F) gsc2 neurons, (H, I, K, L) rln3a NI neurons, and (M, N, O, P) rln3a PAG neurons. Shading indicates standard deviation. Gaps at light onset and offset are due to latency in switching the laser configuration. (A–F) Tg(gsc2:QF2)c721 or (G–P) Tg(rln3a:QF2, he1.1:YFP)c836 driver lines together withTgBAC(gng8:GAL4FF)c426; Tg(UAS:GCaMP7a)zf415; Tg(QUAS:GCaMP7a)c594 with (red trace) or without (green trace) Tg(UAS:ReaChR-RFP)jf50.

Response of gsc2 neurons to shock.

Calcium signaling in the gsc2 neurons of a 7 dpf Tg(gsc2:QF2)c721; Tg(QUAS:GCaMP7a)c594 larva during the delivery of an electric shock (25 V, 200 ms duration), which is denoted by text in upper left corner. Calcium transients imaged at 5.2 Hz. Video sped up 3 X.

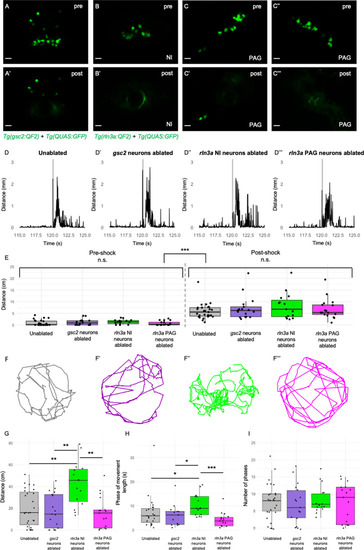
Loss of rln3a NI neurons increases spontaneous locomotor activity. (A-C’’’) Single optical sections from two-photon imaging of 6 dpf (A, A’) Tg(gsc2:QF2)c721; Tg(QUAS:GFP)c578 or (B-C’’’) Tg(rln3a:QF2, he1.1:YFP)c836; Tg(QUAS:GFP)c578 larvae (A, B, C, C’’) before and (A’, B’, C’, C’’’) after laser-mediated ablation of (A, A’) gsc2 neurons, (B, B’) rln3a NI neurons, or (C, C’) left and (C’’, C’’’) right rln3a PAG neurons. Dorsal views, anterior to the top. Scale bars, 10 μm. (D-D’’’) Average locomotor activity during 5 s prior to and after shock. Shock delivery is denoted by the gray line. (E) Mean of total distance traveled during 5 s pre- and post-shock for unablated controls (pre=0.86±0.23 cm, post=5.89±0.64 cm, n=27), or larvae with ablated gsc2 (pre=1.19±0.31, post=7.23±1.20 cm, n=17), rln3a NI (pre=1.30±0.26 cm, post=8.09±1.45 cm, n=15), or rln3a PAG (pre=0.72±0.23 cm, post=6.92±1.07 cm, n=17) neurons. Kruskal-Wallis rank sum test: ***p=2.2 x 10⁻¹⁶. Dunn’s post-hoc tests with adjustment for multiple comparisons show no statistically significant differences within pre- and post-shock epochs, p<0.001*** for each pre-shock vs. post-shock comparison. Unablated control group includes Tg(gsc2:QF2)c721; Tg(QUAS:GFP)c578 and Tg(rln3a:QF2, he1.1:YFP)c836; Tg(QUAS:GFP)c578 siblings of ablated larvae. (F-F’’’) Representative trajectories of 7 dpf larvae with ablated (F’) gsc2 (F’’) rln3a NI or (F’’’) rln3a PAG neurons and (F) sibling controls during the first 115 s of the recording (baseline activity). (G) Mean of distance traveled during the first 115 s of the recording for unablated controls (19.87±3.19 cm) or larvae with ablated gsc2 (17.87±3.84193 cm), rln3a NI (42.80±5.27 cm), or rln3a PAG (15.73±3.55 cm) neurons. Kruskal-Wallis rank sum test: ***p=0.00099. Dunn’s post-hoc tests with adjustment for multiple comparisons show ablated rln3a NI neurons vs. unablated **p=0.0019, ablated rln3a vs. gsc2 NI neurons **p=0.0019, or ablated rln3a NI vs. rln3a PAG neurons **p=0.0019. (H) Average length of movement phases during the pre-shock period, defined as continuous phases of movement with no more than 1 s of prolonged immobility, for unablated controls (7.35±1.34 s) or larvae with ablated gsc2 (6.18±1.14 s), rln3a NI (10.38±1.17 s) or rln3a PAG (4.23±0.74 s) neurons. Kruskal-Wallis rank sum test: **p=0.0013. Dunn’s post-hoc tests with adjustment for multiple comparisons show ablated rln3a NI neurons vs. unablated *p=0.039, ablated rln3a vs. gsc2 NI neurons *p=0.039, or ablated rln3a NI vs. rln3a PAG neurons ***p=0.00055. (I) Mean number of phases of movement during the pre-shock period for unablated controls (7.74±1.03) or larvae with ablated gsc2 (6.88±1.39), rln3a NI (8.13±1.05), or rln3a PAG (7.41±1.33) neurons. Kruskal-Wallis rank sum test: p=0.89.

Confirmation of selective ablation of NI neuronal clusters.

(A-D’) WISH for (A, A’, C, C’) gsc2 or (B, B’, D, D’) rln3a was performed on 7 dpf larvae. (A’, B’) Tg(gsc2:QF2)c721; Tg(QUAS:GFP)c578 larvae whose gsc2 neurons were ablated at 6 dpf. (C’, D’) Tg(rln3a:QF2, he1.1:YFP)c836; Tg(QUAS:GFP)c578 larvae whose rln3a NI neurons were ablated at 6 dpf. (A, B, C, D) Unablated sibling controls for larvae in A’, B’, C’ and D’ respectively. (D, D’) Higher background due to the longer incubation time required to detect rln3a transcripts, which are reduced in Tg(rln3a:QF2, he1.1:YFP)c836 heterozygotes relative to wild type. Dorsal views, anterior to the top.

Loss of rln3a NI neurons increases turning behavior.

Ratio of the total size, in degrees, of all calculated angles during the first 115 s of the recording, divided by total distance traveled in millimeters. (A) Mean ratio for unablated controls (81.94±12.85), or larvae with ablated gsc2 (81.53±15.81), rln3a NI (182.72±15.29), or rln3a PAG (84.26±16.70) neurons. Kruskal-Wallis rank sum test: ***p=0.00017. Dunn’s post-hoc tests with adjustment for multiple comparisons show ablated rln3a NI neurons vs. unablated ***p=0.00038, ablated rln3a vs. gsc2 NI neurons ***p=0.00066, or ablated rln3a NI vs. rln3a PAG neurons ***p=0.00066. (B, C) Unablated control group includes only (B) Tg(gsc2:QF2)c721; Tg(QUAS:GFP)c578 or (C) Tg(rln3a:QF2, he1.1:YFP)c836; Tg(QUAS:GFP)c578 siblings of ablated larvae. Mean ratios: (B) Unablated c721=66.93±15.38. (C) Unablated c836=93.95±19.50. All other groups have the same values as in A. (B) Kruskal-Wallis rank sum test: ***p=0.000097. Dunn’s post-hoc tests with adjustment for multiple comparisons show ablated rln3a NI neurons vs. unablated ***p=0.00057, ablated rln3a vs. gsc2 NI neurons ***p=0.00059, or ablated rln3a NI vs. rln3a PAG neurons ***p=0.00061. (C) Kruskal-Wallis rank sum test: ***p=0.00045. Dunn’s post-hoc tests with adjustment for multiple comparisons show ablated rln3a NI neurons vs. unablated **p=0.0045, ablated rln3a vs. gsc2 NI neurons **p=0.001, or ablated rln3a NI vs. rln3a PAG neurons **p=0.001.

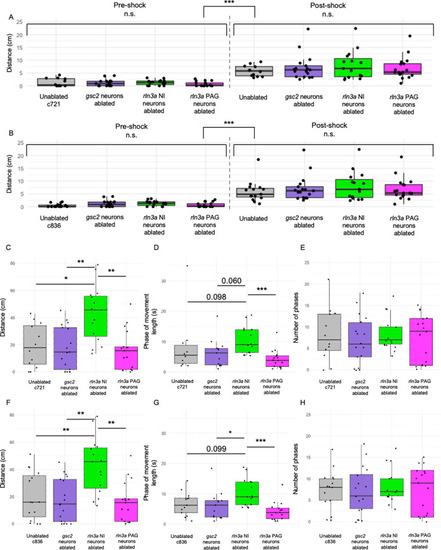
Comparisons between ablated and unablated larvae with the same genotype.

Unablated control group only includes only Tg(gsc2:QF2)c721; Tg(QUAS:GFP)c578 (A, C, D, E) or Tg(rln3a:QF2, he1.1:YFP)c836; Tg(QUAS:GFP)c578 (B, F, G, H) siblings of ablated larvae. (A, B) Mean of distance traveled during 5 s pre- and post-shock. (A) Unablated c721: pre=1.30±0.46 cm, post=5.80±0.61 cm. (B) Unablated c836: pre=0.51±0.18 cm, post=5.96±1.07 cm. (C, F) Mean of distance traveled during the first 115 s of the recording. (C) Unablated c721=19.33±4.59 cm. (F) Unablated c836=20.29±4.55 cm. (D, G) Average length of phases of movement during the pre-shock period, defined as continuous phases of movement with no more than one second of prolonged immobility. (D) Unablated c721=8.28 ± 3.11 s. (G) Unablated c836=6.64±1.07 s. (E, H) Mean number of phases of movement during the pre-shock period. (E) Unablated c721=8.17±1.99. (H) Unablated c836=7.4±1.30. All other groups have the same values as in Figure 8. (A, B) Kruskal-Wallis rank sum test: (A) ***p=4.74 x 10⁻¹⁵, (B) ***p=2.85 x 10⁻¹⁶. (A, B) Dunn’s post-hoc tests with adjustment for multiple comparisons show no statistically significant differences within pre- and post-shock epochs, p<0.001*** for each pre-shock vs. post-shock comparison. (C) Kruskal-Wallis rank sum test: **p=0.0012. Dunn’s post-hoc tests with adjustment for multiple comparisons show ablated rln3a NI neurons vs. unablated *p=0.012, ablated rln3a vs. gsc2 NI neurons **p=0.0023, or ablated rln3a NI vs. rln3a PAG neurons **p=0.0023. (D) Kruskal-Wallis rank sum test: **p=0.0018. Dunn’s post-hoc tests with adjustment for multiple comparisons show ablated rln3a NI neurons vs. unablated p=0.098, ablated rln3a vs. gsc2 NI neurons p=0.060, or ablated rln3a NI vs. rln3a PAG neurons ***p=0.00076. (F) Kruskal-Wallis rank sum test: **p=0.0012. Dunn’s post-hoc tests with adjustment for multiple comparisons show ablated rln3a NI neurons vs. unablated **p=0.0078, ablated rln3a vs. gsc2 NI neurons **p=0.0022, or ablated rln3a NI vs. rln3a PAG neurons **p=0.0022. (G) Kruskal-Wallis rank sum test: **p=0.0012. Dunn’s post-hoc tests with adjustment for multiple comparisons show ablated rln3a NI neurons vs. unablated p=0.099, ablated rln3a vs. gsc2 NI neurons ablated *p=0.042, or ablated rln3a NI vs. rln3a PAG neurons ***p=0.00049. (E, H) Kruskal-Wallis rank sum test: (E) p=0.87, (H) p=0.90.

Acknowledgments
This image is the copyrighted work of the attributed author or publisher, and ZFIN has permission only to display this image to its users. Additional permissions should be obtained from the applicable author or publisher of the image. Full text @ Elife