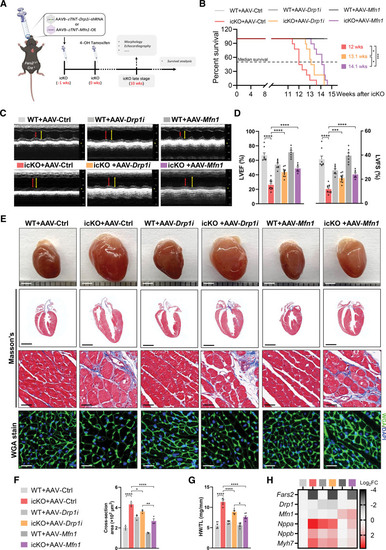
AAV9-mediated Drp1 knockdown or Mfn1 overexpression attenuates myocardial dysfunction induced by Fars2 deficiency and prolongs life span in mice. A, Schematic diagram of experimental protocol of adeno-associated virus 9 (AAV9)–mediated rescue tactics for inducible cardiac-specific Fars2 knockout (icKO) mice. B, Kaplan-Meier survival curves for wild-type (WT) and icKO mice after AAV9 treatment (n =9 per group). The median survival times for each group are marked. C, M-mode echocardiographic images from each group of mice at 10 weeks after icKO. End-systole stages are indicated by red lines and end-diastole stages by yellow lines. D, Left ventricular ejection fraction (LVEF; left panel) and left ventricular fractional shortening (LVFS; right panel; n=7–11 mice per group). E, Representative hearts (scale bar=2 mm): longitudinal sections (scale bar=2 mm), Masson trichrome staining (scale bar=25 μm), hematoxylin & eosin staining (scale bar=25 μm), and wheat germ agglutinin (WGA) staining (scale bar=25 μm) from each group 10 weeks after icKO. F, Quantification of average cardiomyocyte sectional size from E (at least 100 cells from 3 mice per group). G, Ratios of heart weight to tibia length (HW/TL; mg/mm) in different groups (n=6). H, Relative mRNA levels of Fars2, Drp1, Mfn1, and cardiac hypertrophy markers (Nppa, Nppb, and Myh7) in mice 10 weeks after icKO (n=3). *P<0.05; **P<0.01; ***P<0.001; ****P<0.0001.
|