
Figure 7—figure supplement 4.
- ID
- ZDB-FIG-240203-26
- Publication
- Leiba et al., 2024 - Dynamics of macrophage polarization support Salmonella persistence in a whole living organism
- Other Figures
-
- Figure 1
- Figure 1—figure supplement 1.
- Figure 2
- Figure 2—figure supplement 1.
- Figure 3
- Figure 3—figure supplement 1.
- Figure 3—figure supplement 2.
- Figure 4.
- Figure 5.
- Figure 6
- Figure 6—figure supplement 1.
- Figure 7
- Figure 7—figure supplement 1.
- Figure 7—figure supplement 2.
- Figure 7—figure supplement 3.
- Figure 7—figure supplement 4.
- Figure 8.
- Figure 9
- Figure 9—figure supplement 1.
- Figure 10.
- All Figure Page
- Back to All Figure Page
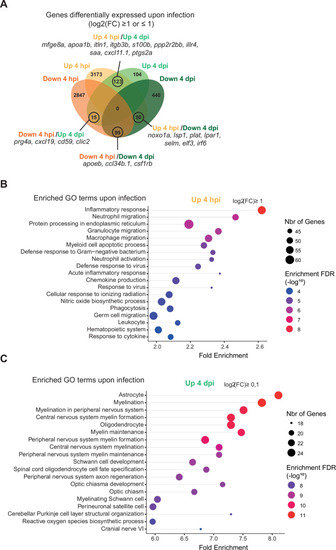
RNAseq analysis shows dynamic transcriptional profiles of macrophages upon Tg( |