
Figure 3
- ID
- ZDB-FIG-240203-15
- Publication
- Leiba et al., 2024 - Dynamics of macrophage polarization support Salmonella persistence in a whole living organism
- Other Figures
-
- Figure 1
- Figure 1—figure supplement 1.
- Figure 2
- Figure 2—figure supplement 1.
- Figure 3
- Figure 3—figure supplement 1.
- Figure 3—figure supplement 2.
- Figure 4.
- Figure 5.
- Figure 6
- Figure 6—figure supplement 1.
- Figure 7
- Figure 7—figure supplement 1.
- Figure 7—figure supplement 2.
- Figure 7—figure supplement 3.
- Figure 7—figure supplement 4.
- Figure 8.
- Figure 9
- Figure 9—figure supplement 1.
- Figure 10.
- All Figure Page
- Back to All Figure Page
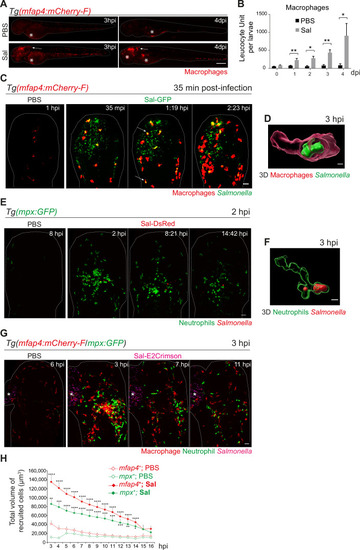
Early phase of Salmonella hindbrain ventricle (HBV) infection induces strong macrophage and neutrophil responses. (A–D) Tg(mfap4:mCherry-F) larvae were injected with either PBS or Sal-GFP in HBV. (A) Representative fluorescent images of larvae showing macrophage recruitment at the site of injection at 3 hpi and at 4 dpi. Asterisk: auto-fluorescence. Scale bar: 200 μm. (B) Quantification of total macrophages at 0, 1, 2, 3, and 4 dpi. One representative of three replicates (mean number of leukocyte units/larva ± SEM, n0 dpi = 24, n1 dpi = 11, n2 dpi = 6, n3,4 dpi = 5 per condition, Mann–Whitney test, two-tailed, *p < 0.05, **p < 0.01). (C) Representative maximum projections of fluorescent images extracted from 4D sequences using light sheet fluorescence microscopy starting 35 min post-infection during 2 hr, showing recruitment of macrophages (red) to the infection site (Salmonella, green). Scale bar: 30 μm. (D) 3D reconstruction of a macrophage phagocytosing Salmonella at 3 hpi. Scale bar: 5 μm. (E, F) Tg(mpx:GFP) larvae were injected with PBS or Sal-DsRed in HBV. (E) Representative maximum projections of fluorescent images extracted from 4D sequences using confocal microscopy at 2 hpi during 13 hr, showing recruitment of neutrophils (green) to the infection site (Salmonella, red). Scale bar: 35 μm. (F) 3D reconstruction of a neutrophil phagocytosing Salmonella at 2 hpi. Scale bar: 5 μm. (G, H) Tg(mfap4:mCherry-F/mpx:GFP) larvae were injected with either PBS or Sal-E2Crimson in HBV. (G) Representative maximum projections extracted from 4D sequences using confocal microscopy from 3 to 14 hpi showing recruitment of both neutrophils (green) and macrophages (red) to the infection sites. Asterisk: auto-fluorescence. Scale bar: 50 μm. (H) Quantification of the total volume of recruited cells (mfap4+ or mpx+ cells) from 3 to 16 hpi. Data of three replicates pooled (mean volume/larva ± SEM, n = 11 from 3 to 4 hpi, n = 15 from 5 to 14 hpi, n = 4 from 15 to 16 hpi per condition, Mann–Whitney test, two-tailed, significance of Sal versus PBS conditions *p < 0.05, **p < 0.01, ***p < 0.001, ****p < 0.0001). |