|
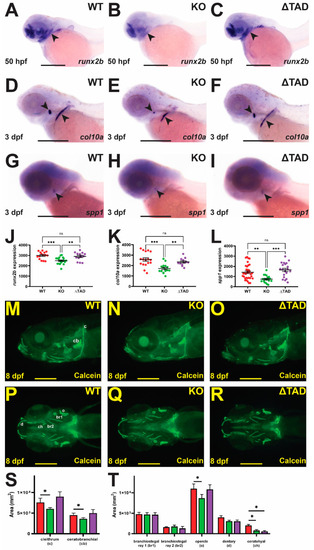
Effect of Stat3 mutations on bone formation. Representative images of Stat3 wildtype (WT: A,D,G,M,P), knockout (KO: B,E,H,N,Q), and transactivation domain truncation (ΔTAD: C,F,I,O,R) mutant embryos subjected to WISH at 50 hpf with runx2b (A–C) and at 3 dpf with col10a (D–F) or spp1 (G–I) in lateral view as indicated with black arrowheads, or at 8 dpf with calcein staining (lateral: M–O; ventral: P–R), with scale bars representing 200 μm. Quantification of area of staining for runx2b (J), col10a (K), and spp1 (L), showing individual values for each embryo and of specific bones (S,T), with mean, SEM, and statistical significance indicated (*** p < 0.001, ** p < 0.01, * p < 0.05, ns: not significant). Abbreviations: br1/2: branchiostegal ray 1/2; c: cleithrum; cb: ceratobranchial; ch: ceratohyal; d: dentary; o: opercula.
|