|
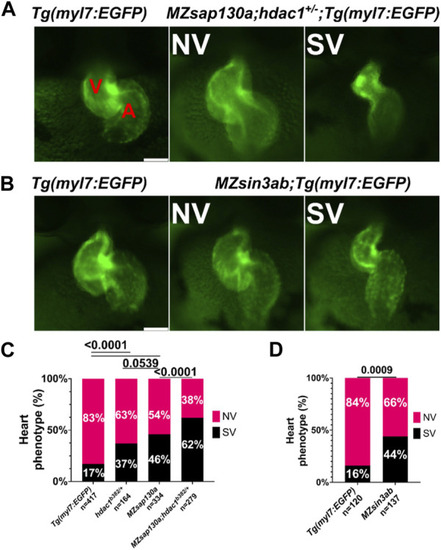
sap130a shows an association with hdac1 and MZsin3ab mutants have SVs (A) Representative image of Tg(myl7:EGFP) and MZsap130a;hdac1b382/+;Tg(myl7:EGFP) NV and SVs at 48hpf. (B) Representative image of Tg(myl7:EGFP) and MZsin3ab;Tg(myl7:EGFP) NV and SVs at 48hpf. (C) Quantification of heart phenotype proportions in Tg(myl7:EGFP), MZsap130a;Tg(myl7:EGFP), hdac1b382/+;Tg(myl7:EGFP) and MZsap130a;hdac1b382/+;Tg(myl7:EGFP). The p-values are fisher’s exact test. (D) Quantification of heart phenotype proportions in Tg(myl7:EGFP) and MZsin3ab;Tg(myl7:EGFP). The p-values are fisher’s exact test. V and A are ventricle and atria, respectively. Scale bar 100 μm.
|