Fig. 3
- ID
- ZDB-FIG-230318-18
- Publication
- Kurolap et al., 2022 - Bi-allelic variants in neuronal cell adhesion molecule cause a neurodevelopmental disorder characterized by developmental delay, hypotonia, neuropathy/spasticity
- Other Figures
- All Figure Page
- Back to All Figure Page
|
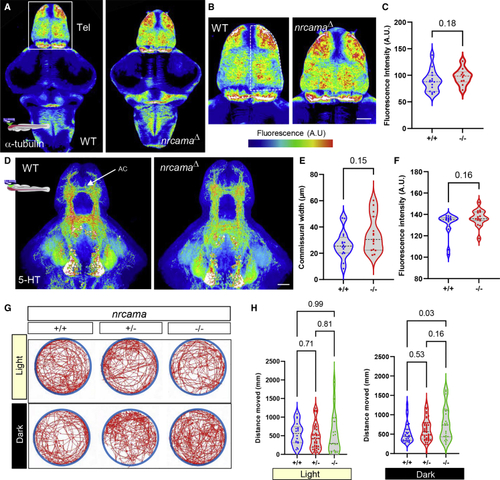
Zebrafish nrcamaΔ mutants display altered axonal projections and behavioral activity (A and B) Confocal imaging and maximum intensity projection of whole-mount 5-day-old larval brain immunostained against α-tubulin, labeling axonal processes. The brains are imaged from the dorsal side and showing the telencephalon (Tel). Heatmap color scale to demonstrate regions with high fluorescence intensity (black, low intensity and red/white, high intensity). (C) Quantification of fluorescence intensity (arbitrary units, A.U.) show nrcamaΔ mutant larvae display a trend toward an increased number of axons and terminals in the dorsal telencephalon (dashed outline in B) compared to wild-type siblings (p = 0.18; wild type 89.18 ± 19.95 A.U. n = 15; nrcamaΔ 97.50 ± 15.41 A.U., n = 10; variance shown as standard deviation from mean). (D) 5-HT immunostaining of 5-day-old brain imaged from the ventral side, showing hypothalamic cell groups and ascending fiber projections, including the anterior telencephalic commissure (AC). Heatmap color scale to demonstrate regions with high fluorescence intensity (black, low intensity and red/white, high intensity). (E and F) Quantification of fluorescence intensity (arbitrary units, A.U.) in the telencephalon shows a trend toward increased thickness of the anterior commissure (p = 0.15; wild type 26.6 ± 10.3 A.U., n = 16; nrcamaΔ 34.3 ± 13.8 A.U., n = 15; variance shown as standard deviation from mean), and mean intensity (p = 0.16; wild type 131.1 ± 10.9 A.U., n = 16; nrcamaΔ 136.8 ± 7.7 A.U., n = 15; variance shown as standard deviation from mean) in the nrcamaΔ mutant larvae compared to wild-type siblings. (G) Overview of general locomotion in 5-day-old freely swimming nrcamaΔ mutants and wild-type siblings shown as average distance moved in mm during 6 min in white light or darkness. Swimming pattern and trajectory plotted as red line for each genotype in the arena (blue circle). (H) Quantification of general locomotion in light or darkness. Under white light conditions, nrcamaΔ mutants and wild-type siblings displayed similar locomotion behavior (p = 0.99; wild type 550.3 ± 299.8 mm, n = 18; heterozygous nrcamaΔ 466.2 ± 345.1 mm, n = 46; homozygous nrcamaΔ 531.7 ± 526.9 mm, n = 19). However, mutants displayed significantly increased swimming activity in darkness (p = 0.03; wild type 530.3 ± 258.9 mm, n = 27; heterozygous nrcamaΔ 613.7 ± 295.7 mm, n = 47; homozygous nrcamaΔ 764.4 ± 428.2 mm, n = 23). |
| Antibodies: | |
|---|---|
| Fish: | |
| Anatomical Terms: | |
| Stage: | Day 5 |
| Fish: | |
|---|---|
| Condition: | |
| Observed In: | |
| Stage: | Day 5 |

