FIGURE

Fig. 5.

ID
ZDB-FIG-230211-78
Publication
Hajiabadi et al., 2022 - Deep-learning microscopy image reconstruction with quality control reveals second-scale rearrangements in RNA polymerase II clusters
Other Figures
All Figure Page
Back to All Figure Page
Fig. 5.

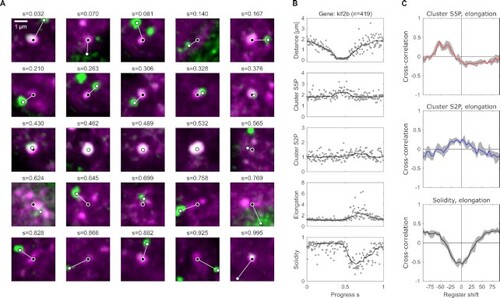
Pseudo-time analysis of data from fixed embryos relates transient engagement and activation of a gene to the phosphorylation and shape changes observed in live embryos. (A) Example images of Pol II Ser5P (magenta signal) clusters sorted by a pseudo-time progress coordinate (s, periodic, defined on the interval [0,1)), which is calculated based on interaction with the gene klf2b (green represents oligopaint fluorescence in situ hybridization signal for klf2b). Center positions (weighted centroid) are indicated for the Pol II Ser5P cluster (white circle with black filling) and the gene (black circle with white filling) and connected with a white line for illustration. For details of the reconstruction, see Figure S8 (Supplementary Material). For an overview containing all eight genes that were assessed, see Fig. S9B (Supplementary Material). (B) Pol II Ser5P and Ser2P intensity, elongation, and solidity of Pol II Ser5P clusters sorted by pseudo-time s. A total of n = 186 clusters from N = 4 independent samples, obtained in two independent experiments, were included in the analysis. (C) Cross-correlation analyses for different register shifts in the coordinate s, the register shift is in units of data points by which the coordinate s was shifted. Gray regions indicate 95% bootstrap CI.

Expression Data

Expression Detail
Antibody Labeling
Phenotype Data

Phenotype Detail
Acknowledgments
This image is the copyrighted work of the attributed author or publisher, and ZFIN has permission only to display this image to its users. Additional permissions should be obtained from the applicable author or publisher of the image. Full text @ PNAS Nexus