Fig. 1
- ID
- ZDB-FIG-221229-8
- Publication
- Sun et al., 2021 - C24:0 avoids cold exposure-induced oxidative stress and fatty acid β-oxidation damage
- Other Figures
- All Figure Page
- Back to All Figure Page
|
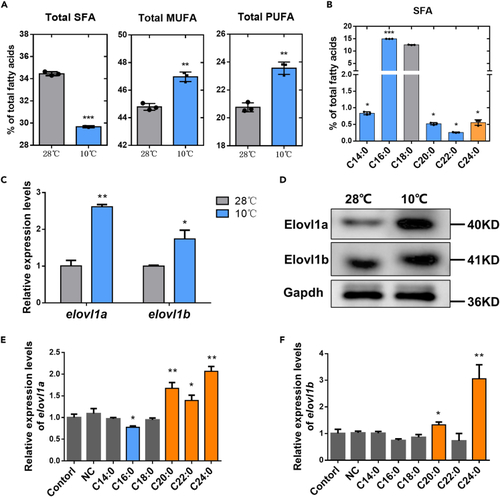
Fatty acid compositions and elovl1/Elovl1 expression levels of zebrafish liver (ZFL) cells (A) The fatty acid compositions of ZFL cells at 28°C and 10°C. (B) The SFA species contents of ZFL cells at 10°C. (C) The mRNA expression levels of elovl1a and elovl1b in ZFL cells at 28°C and 10°C. (D) The protein expression levels of Elovl1a and Elovl1b in ZFL cells at 28°C and 10°C. (E and F) The expression levels of elovl1a (E) and elovl1b (F) in control and SFA-treatment ZFL cells at 28°C. The blue and orange colors in (B), (E), and (F), respectively, meant significant decrease and increase in parameters of treated groups, compared with the control (the control in (B) was the SFA species content of ZFL cells at 28°C). Data were given as means ± SD of three biological replicates. The statistical analyses were conducted by t test. The asterisks labeled above the error bars indicated significant differences (∗p < 0.05, ∗∗p < 0.01, ∗∗∗p < 0.001). SFA, saturated fatty acid; MUFA, monounsaturated fatty acid; PUFA, polyunsaturated fatty acid; NC, negative control; elovl1, fatty acyl elongase 1; Gapdh, glyceraldehyde-3-phosphate dehydrogenase. |

