
Fig. 2
- ID
- ZDB-FIG-220815-2
- Publication
- Ethiraj et al., 2022 - Colorimetric and fluorescent TRAP assays for visualising and quantifying fish osteoclast activity
- Other Figures
- All Figure Page
- Back to All Figure Page
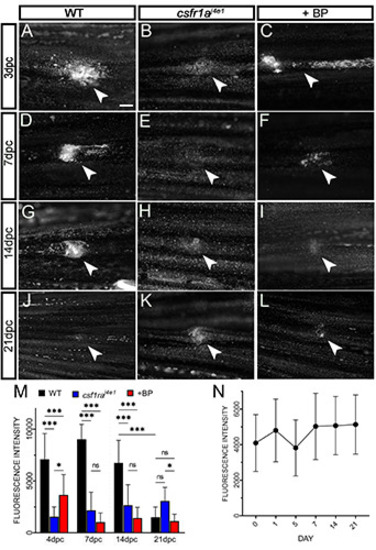
A fluorescent TRAP method labels osteoclast activity in zebrafish bone fractures. A-L) Whole-mount widefield fluorescent images of adult fin ray fractures processed for ELF97 fluorescence. Fins were fixed at 3 dpc (A-C), 7 dpc (D-F), 14 dpc (G-I) and 21 dpc (J-L), and were either WT (A,D,G,J), homozygous csf1raj4e1 mutants (B, E, H, K) or treated with 100 μg/mL bisphosphonate (+BP; C, F, I, L). M: Mean fluorescence of crush sites at given timepoints and under the three conditions. ***= p<0.001, *=p<0.05, (ANOVA with Bonferroni multiple comparisons test, n=12). N: Mean ELF97 fluorescence at the crush sites of 1 dpc WT zebrafish following storage for 0, 1, 5, 7, 14, 21 days. There was no statistically significant variation over the course of 21 days of storage compared against initial staining (ANOVA, Tukey's multiple comparisons test, n=12). Scale bar: A) 100 μm. |