
Fig. 2
- ID
- ZDB-FIG-220620-24
- Publication
- Cairelli et al., 2022 - Fluid mechanics of the zebrafish embryonic heart trabeculation
- Other Figures
- All Figure Page
- Back to All Figure Page
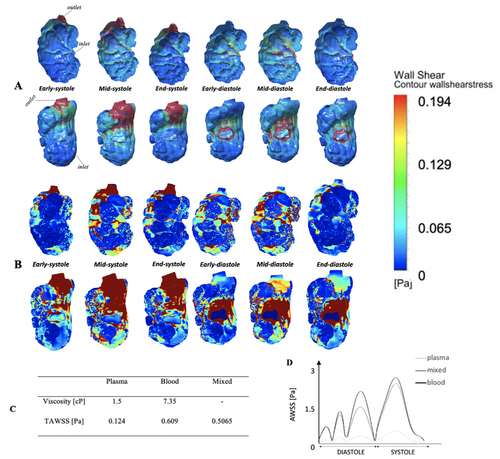
Fig 2. Endocardial WSS profiles compared at different cardiac phases, with plasma viscosity and with the mixed-viscosity. (A) Contour maps of endocardial WSS in a representative embryonic ventricle, over the cardiac cycle, with the assumption that fluid has the viscosity of plasma (1.5cP). Top row: ventral view of the outer curvature of the ventricle; bottom row: dorsal view of the inner curvature. (B) The same contour map of WSS, but for the mixed-viscosity assumption, where WSS results for plasma viscosity were adopted in the intra-trabecular spaces, but WSS results for whole blood viscosity were adopted for the trabeculation ridges. This scenario is generated considering that red blood cells do not enter the narrow intra-trabecular spaces often. (C) Time-averaged WSS over the ventricular surface calculated in simulations where the fluid viscosity was assumed to be that of plasma, blood, or mixed. (D) Temporal waveform of WSS averaged over the entire ventricular surface for the three scenarios. |