
Fig. 2
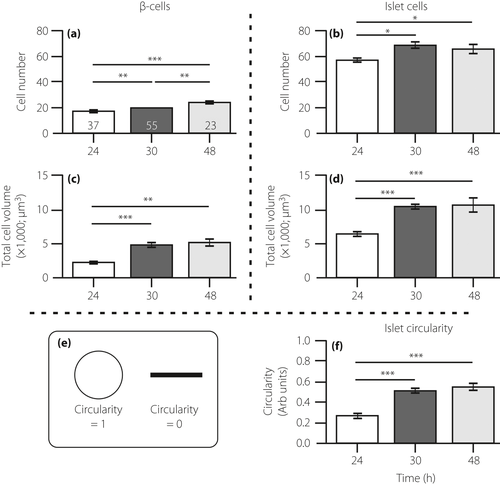
Quantification of the immunolabeling results. Embryos were fixed at 24, 30 and 48 h post-fertilization (hpf), after which the β-cells and islet cells were dual-immunolabeled with an insulin antibody and islet 1 and 2 antibody, respectively. These bar graphs show the number of (a) β-cells and (b) islet cells; the volume of cells expressing (c) insulin and (d) islet 1 and 2; and (e,f) the circularity of the islet, such that a more rounded islet has a circularity value approaching 1, whereas a more elongated islet has a circularity value near to 0. The data are shown as the mean ± standard error of n = 37, n = 55 and n = 23, at 24 hpf, 30 hpf and 48 hpf, respectively, as shown in the bars in (a). The asterisks indicate the significance difference at P < 0.05*, P < 0.01** or P < 0.001*** using the Mann–Whitney U-test. |