
Fig. 4
- ID
- ZDB-FIG-210602-19
- Publication
- Frétaud et al., 2020 - A new reporter zebrafish line unveils heterogeneity among lymphatic endothelial cells during development
- Other Figures
- All Figure Page
- Back to All Figure Page
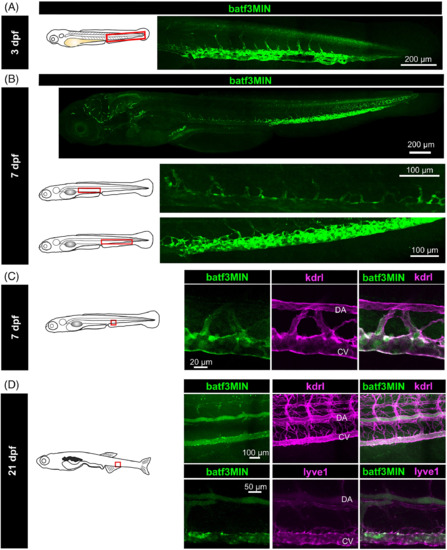
Caudal batf3MIN positive vessels co-express BEC and LEC markers. A, Schematic diagram of 3 dpf zebrafish larvae in lateral view. Red box indicated the tail region presented in the right panel. Maximum projection of a 3 dpf Tg(batf3MIN:eGFP) transgenic zebrafish tail showing eGFP signal in CV and at the basis of the ISV. B, Upper panel: maximum projection of a 7 dpf whole Tg(batf3MIN:eGFP) transgenic larvae. Middle panel: schematic diagram of zebrafish larvae in lateral view. Red box indicated the trunk region presented in the right panel. Maximum projection of a 7 dpf Tg(batf3MIN:eGFP) transgenic fish showing eGFP signal in the PCV and at the basis of the ISV. Lower panel: schematic diagram of zebrafish larvae in lateral view. Red box indicated the tail region presented in the right panel. Maximum projection of a 7 dpf Tg(batf3MIN:eGFP) transgenic fish showing eGFP signal in the CV. C, Schematic diagram of 7 dpf zebrafish larvae in lateral view. Red box indicated the tail region presented in the right panel. Maximal projection of a 7 dpf double Tg(batf3MIN:eGFP) x Tg(kdrl:Hsa.HRAS-mCherry) transgenic fish. D, Schematic diagram of 21 dpf zebrafish in lateral view. Red box indicated the trunk region imaged in the right panel. Upper right panels: maximum projection of a 21 dpf double Tg(batf3MIN:eGFP) x Tg(kdrl:Hsa.HRAS-mCherry) transgenic fish. Lower right panels: maximum projection of a 21 dpf double Tg(batf3MIN:eGFP) x Tg(lyve1:dsRed2nz101) transgenic fish. eGFP positive cells were detected in the CV while in the DA fluorescence correspond to signal background. DA, dorsal aorta; CV, caudal vein; ISV, intersegmental vessels |