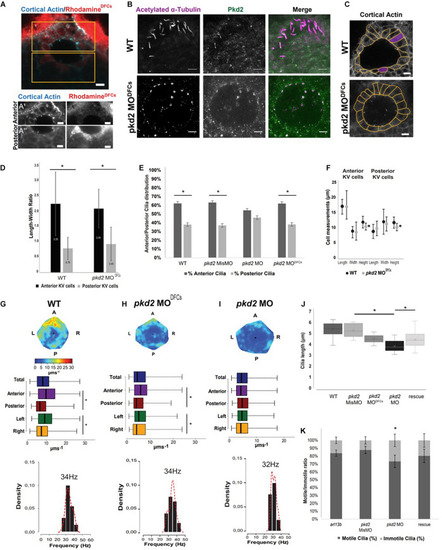
pkd2 knockdown in the DFCs rescues KV fluid flow pattern. (A) Immunostaining for cortical actin and rhodamine showing the result of a successful injection of pkd2 MO into DFCs, anterior (A’) and posterior (A”) panels in the different channels allow for better contrast/brightness balance; (B) Immunostaining for Pkd2 in WT and pkd2MODFCs embryos; (C) Representative images of KV architecture from one WT embryo and one pkd2 MODFCs injected embryo. (D) Quantification of the differences in length to width ratio in the KV of WT (n = 6) and pkd2 MODFCs (n = 9). (E) Cilia distribution in the antero-posterior axis of the KV of WT embryos (n = 22) and embryos injected with pkd2 MisMO (n = 6), pkd2 MO (n = 48) and pkd2 MODFCs (n = 15). (F) Quantification of the differences in cellular length, width, and height, in the same WT and pkd2 MODFCs injected embryos from panel (D). (G–I) Fluid flow heatmap and quantification of WT (n = 8), pkd2 MODFCs (n = 6) and pkd2 MO 1-cell stage embryos (n = 7), respectively. Asterisks represent statistical significance (Wilcoxon Test, p-value < 0.05). (J) 3D cilia length measurement in WT (n = 23), pkd2 MisMO (n = 8), pkd2 MO 1-cell stage (n = 25), rescue (n = 19), and pkd2 MODFCs (n = 10). (K) Motile/Immotile cilia ratio in live embryos injected with arl13b-mCherry mRNA (n = 8) and injected with pkd2 MisMO (n = 10), pkd2 MO (n = 6) and pkd2 MO rescued with Xenopus pkd2 mRNA (n = 5). Asterisks represent statistical significance (p < 0.05) with paired t-test. Scale bars 10 μm. L, left; R, right; A, anterior; P, posterior.
|
