FIGURE SUMMARY
Title

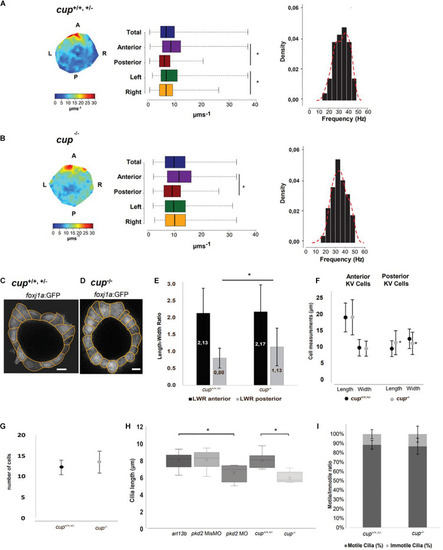
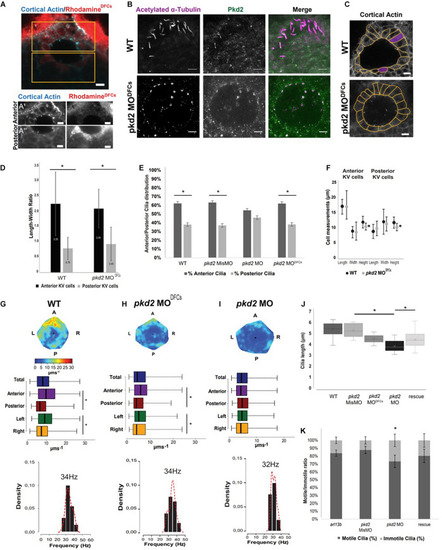
Pkd2 Affects Cilia Length and Impacts LR Flow Dynamics and Dand5

Authors
Jacinto, R., Sampaio, P., Roxo-Rosa, M., Pestana, S., Lopes, S.S.
Source
Full text @ Front Cell Dev Biol

cup–/– mutants have fluid flow defects in the LRO. (A,B) Fluid flow heatmap and quantification of cup siblings with straight tail (n = 8) and cup/ mutants with curly tail (n = 9), respectively. Asterisks represent statistical significance (Wilcoxon Test, p-value < 0.05). Cilia beat frequency (CBF) of cup siblings and cup–/– mutants, respectively; cup siblings show an average CBF of 34.8 Hz and cup/ mutants an average of 34.4 Hz (paired t-test, p-value < 0.05). (C,D) Representative image of cell shapes from one KV from cup siblings and one KV from cup–/– mutants, respectively. (E) Quantification of differences in length to width ratio and (F) differences in cellular length and width in cup siblings (n = 6) and cup mutants (n = 5); asterisks represent statistical significance (paired t-test, p-value < 0.05). (G) Number of cells present in cup mutants and sibling in the middle plane. (H) 3D cilia length measurements in live embryos injected with 50 pg of arl13b-mCherry mRNA (arl13b; n = 16) and injected with pkd2 MisMO (n = 6), pkd2 MO (n = 6), cup mutants (n = 8), and cup siblings (n = 13) with arl13b-mCherry mRNA; asterisks represent statistical significance (paired t-test, p-value < 0.05) (I) Motile/Immotile cilia ratio in the same cup mutants and cup siblings as in panel (H). Scale bars 10 μm. L, left; R, right; A, anterior; P, posterior.

pkd2 knockdown in the DFCs rescues KV fluid flow pattern. (A) Immunostaining for cortical actin and rhodamine showing the result of a successful injection of pkd2 MO into DFCs, anterior (A’) and posterior (A”) panels in the different channels allow for better contrast/brightness balance; (B) Immunostaining for Pkd2 in WT and pkd2MODFCs embryos; (C) Representative images of KV architecture from one WT embryo and one pkd2 MODFCs injected embryo. (D) Quantification of the differences in length to width ratio in the KV of WT (n = 6) and pkd2 MODFCs (n = 9). (E) Cilia distribution in the antero-posterior axis of the KV of WT embryos (n = 22) and embryos injected with pkd2 MisMO (n = 6), pkd2 MO (n = 48) and pkd2 MODFCs (n = 15). (F) Quantification of the differences in cellular length, width, and height, in the same WT and pkd2 MODFCs injected embryos from panel (D). (G–I) Fluid flow heatmap and quantification of WT (n = 8), pkd2 MODFCs (n = 6) and pkd2 MO 1-cell stage embryos (n = 7), respectively. Asterisks represent statistical significance (Wilcoxon Test, p-value < 0.05). (J) 3D cilia length measurement in WT (n = 23), pkd2 MisMO (n = 8), pkd2 MO 1-cell stage (n = 25), rescue (n = 19), and pkd2 MODFCs (n = 10). (K) Motile/Immotile cilia ratio in live embryos injected with arl13b-mCherry mRNA (n = 8) and injected with pkd2 MisMO (n = 10), pkd2 MO (n = 6) and pkd2 MO rescued with Xenopus pkd2 mRNA (n = 5). Asterisks represent statistical significance (p < 0.05) with paired t-test. Scale bars 10 μm. L, left; R, right; A, anterior; P, posterior.

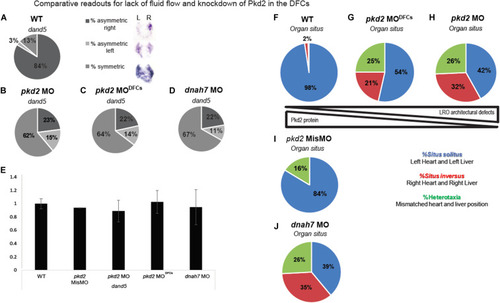
Comparative readouts for lack of fluid flow and knockdown of Pkd2 in the DFCs (A–D)dand5 expression pattern quantification by in situ hybridization of WT embryos, pkd2 MO, pkd2 MODFCs, and dnah7 MO. (E)dand5 expression level in fold change quantified by qRT-PCR; asterisks represent statistical significance (paired t-test, p-value < 0.05). (F–J) Organ situs quantification by scoring heart and liver laterality in the same larvae in WT, pkd2 MODFCs, pkd2 MO 1-cell stage, pkd2 Mismatch MO and dnah7 MO.

Acknowledgments
This image is the copyrighted work of the attributed author or publisher, and ZFIN has permission only to display this image to its users. Additional permissions should be obtained from the applicable author or publisher of the image. Full text @ Front Cell Dev Biol