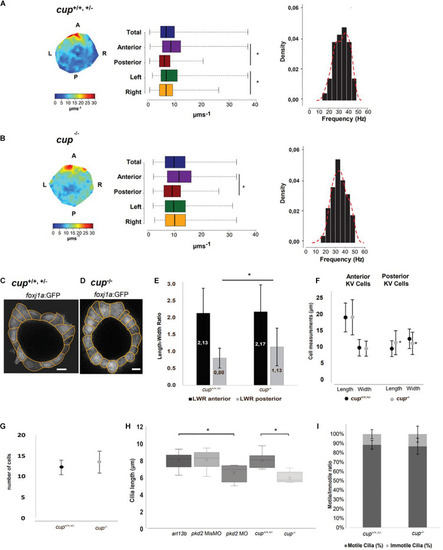
cup–/– mutants have fluid flow defects in the LRO. (A,B) Fluid flow heatmap and quantification of cup siblings with straight tail (n = 8) and cup–/– mutants with curly tail (n = 9), respectively. Asterisks represent statistical significance (Wilcoxon Test, p-value < 0.05). Cilia beat frequency (CBF) of cup siblings and cup–/– mutants, respectively; cup siblings show an average CBF of 34.8 Hz and cup–/– mutants an average of 34.4 Hz (paired t-test, p-value < 0.05). (C,D) Representative image of cell shapes from one KV from cup siblings and one KV from cup–/– mutants, respectively. (E) Quantification of differences in length to width ratio and (F) differences in cellular length and width in cup siblings (n = 6) and cup mutants (n = 5); asterisks represent statistical significance (paired t-test, p-value < 0.05). (G) Number of cells present in cup mutants and sibling in the middle plane. (H) 3D cilia length measurements in live embryos injected with 50 pg of arl13b-mCherry mRNA (arl13b; n = 16) and injected with pkd2 MisMO (n = 6), pkd2 MO (n = 6), cup mutants (n = 8), and cup siblings (n = 13) with arl13b-mCherry mRNA; asterisks represent statistical significance (paired t-test, p-value < 0.05) (I) Motile/Immotile cilia ratio in the same cup mutants and cup siblings as in panel (H). Scale bars 10 μm. L, left; R, right; A, anterior; P, posterior.
|
